A joint post by Howard Hudson and Lily Ciric Hoffmann.
…
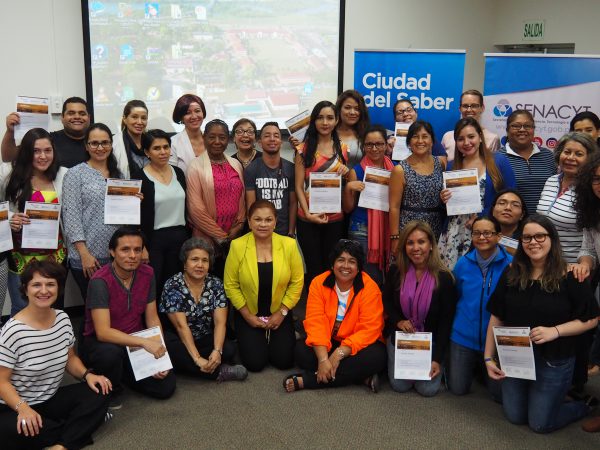
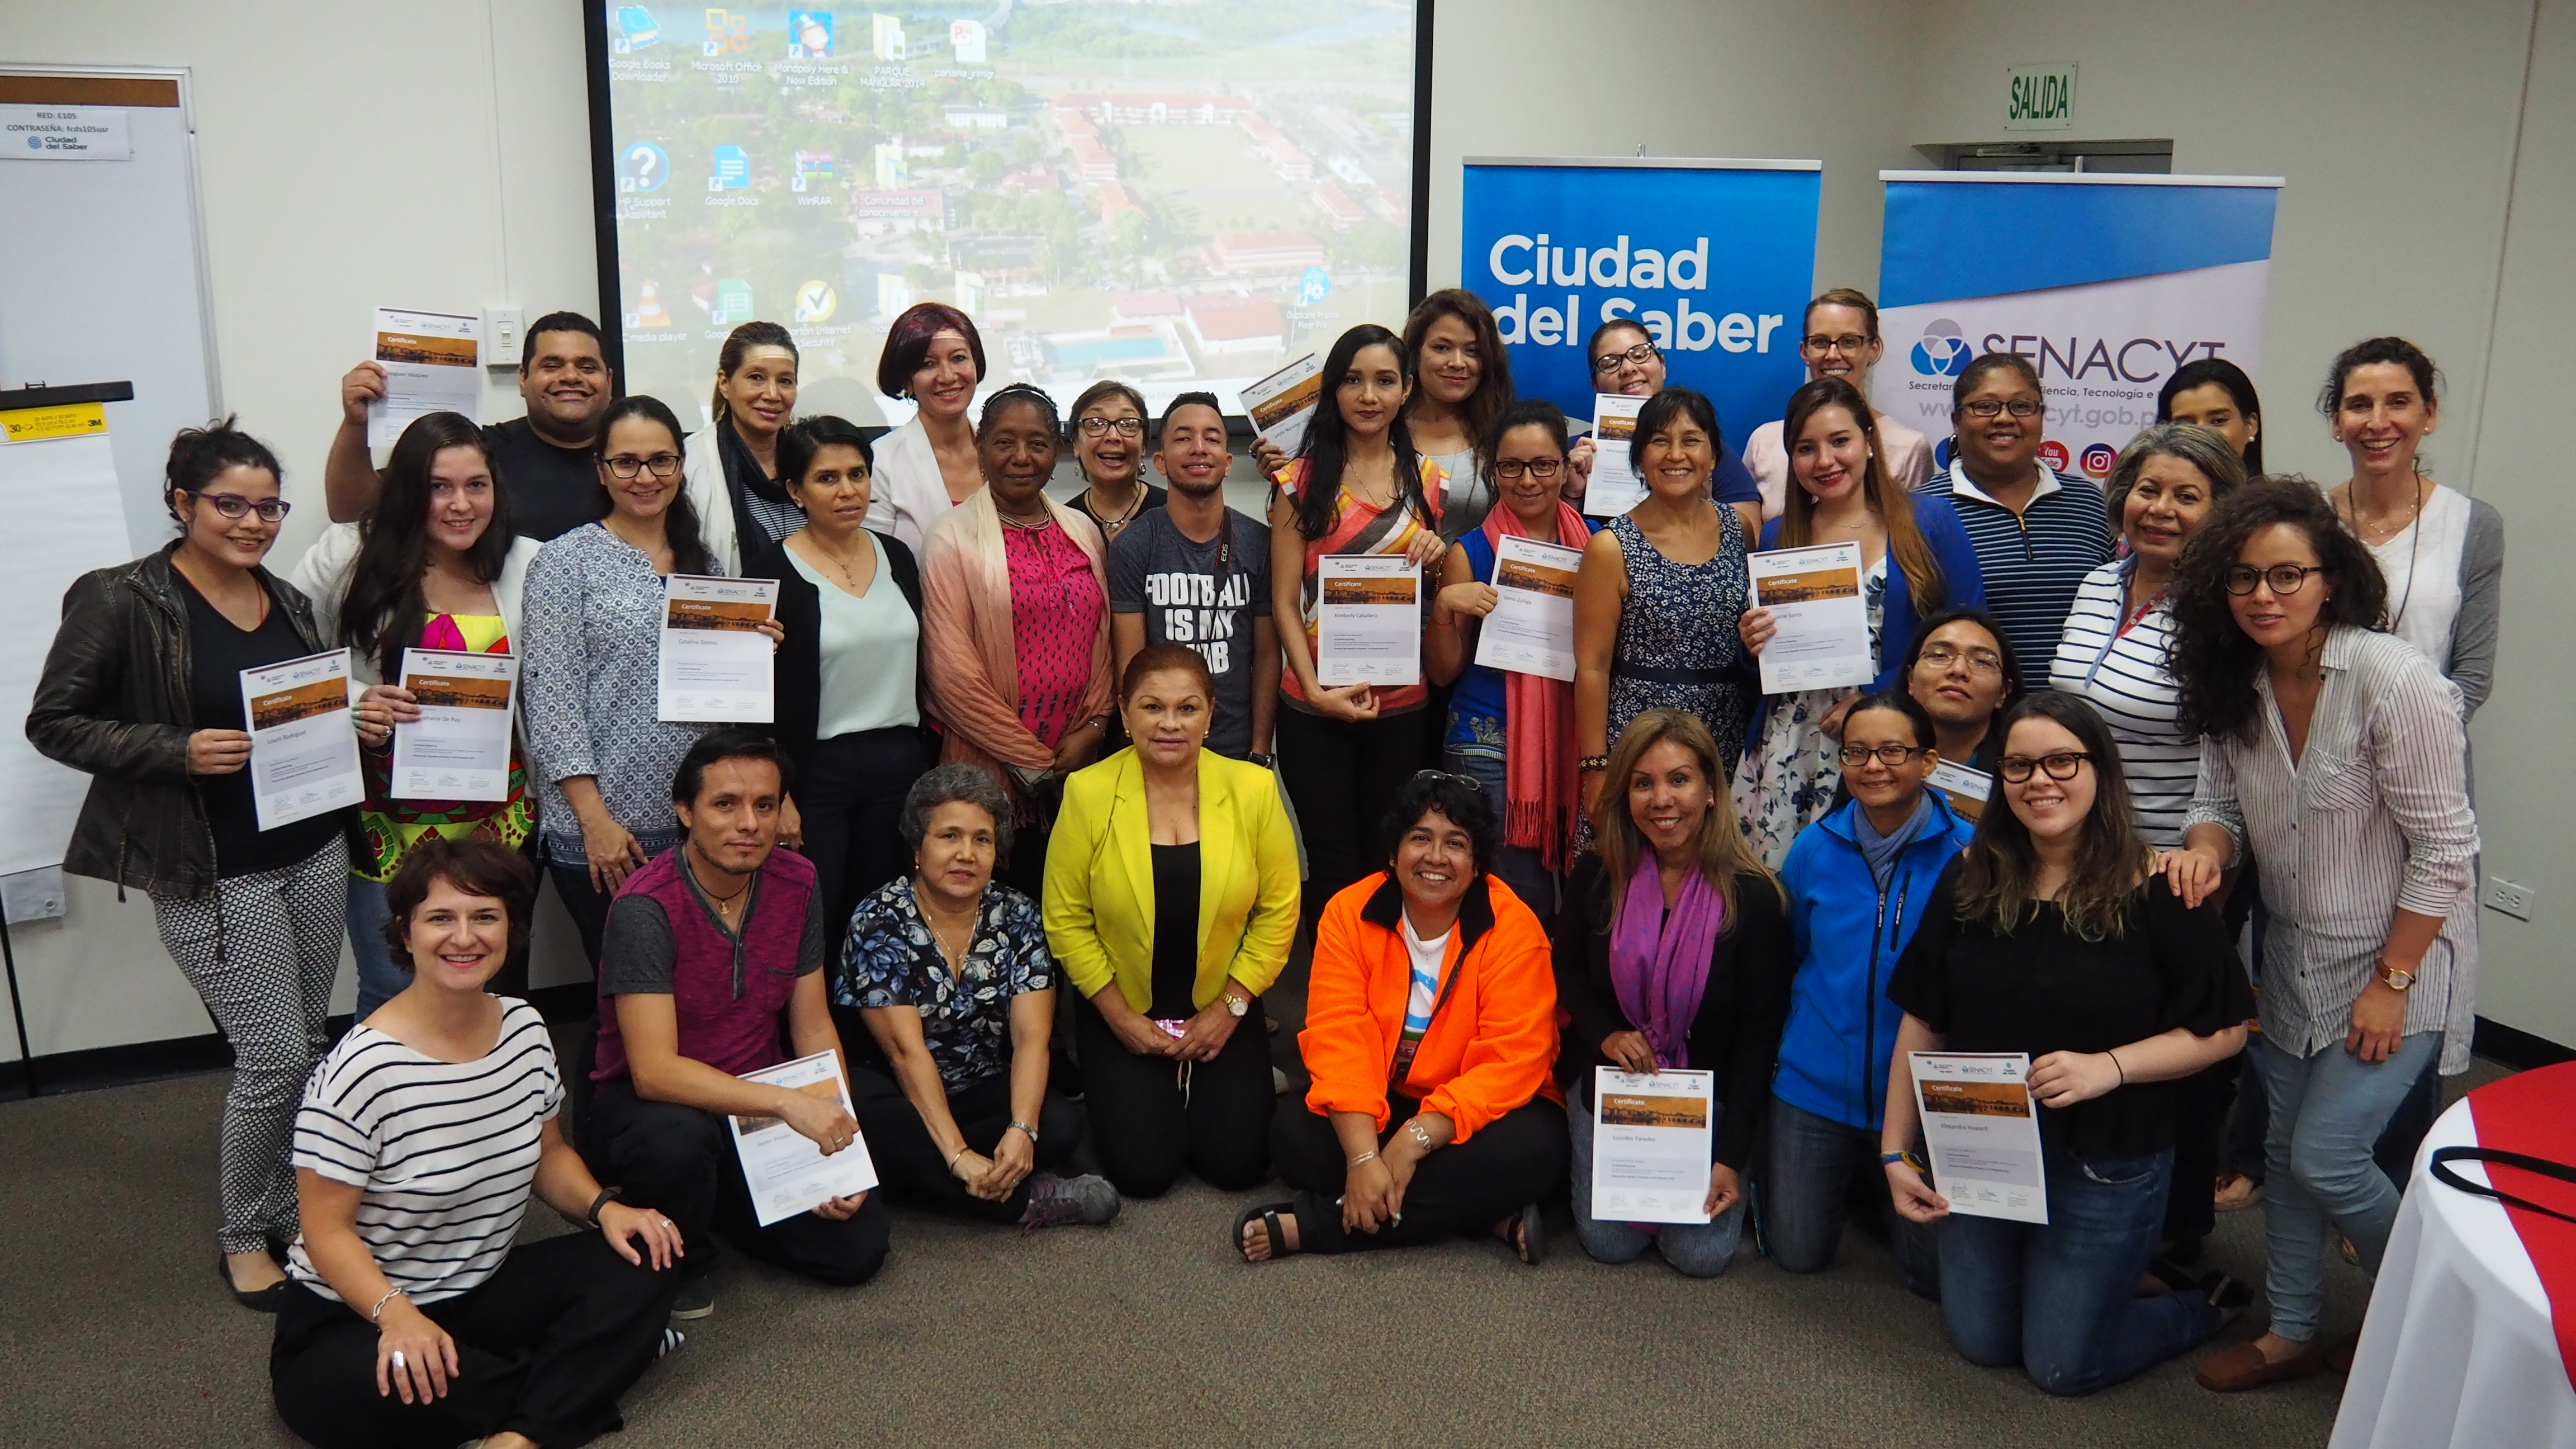
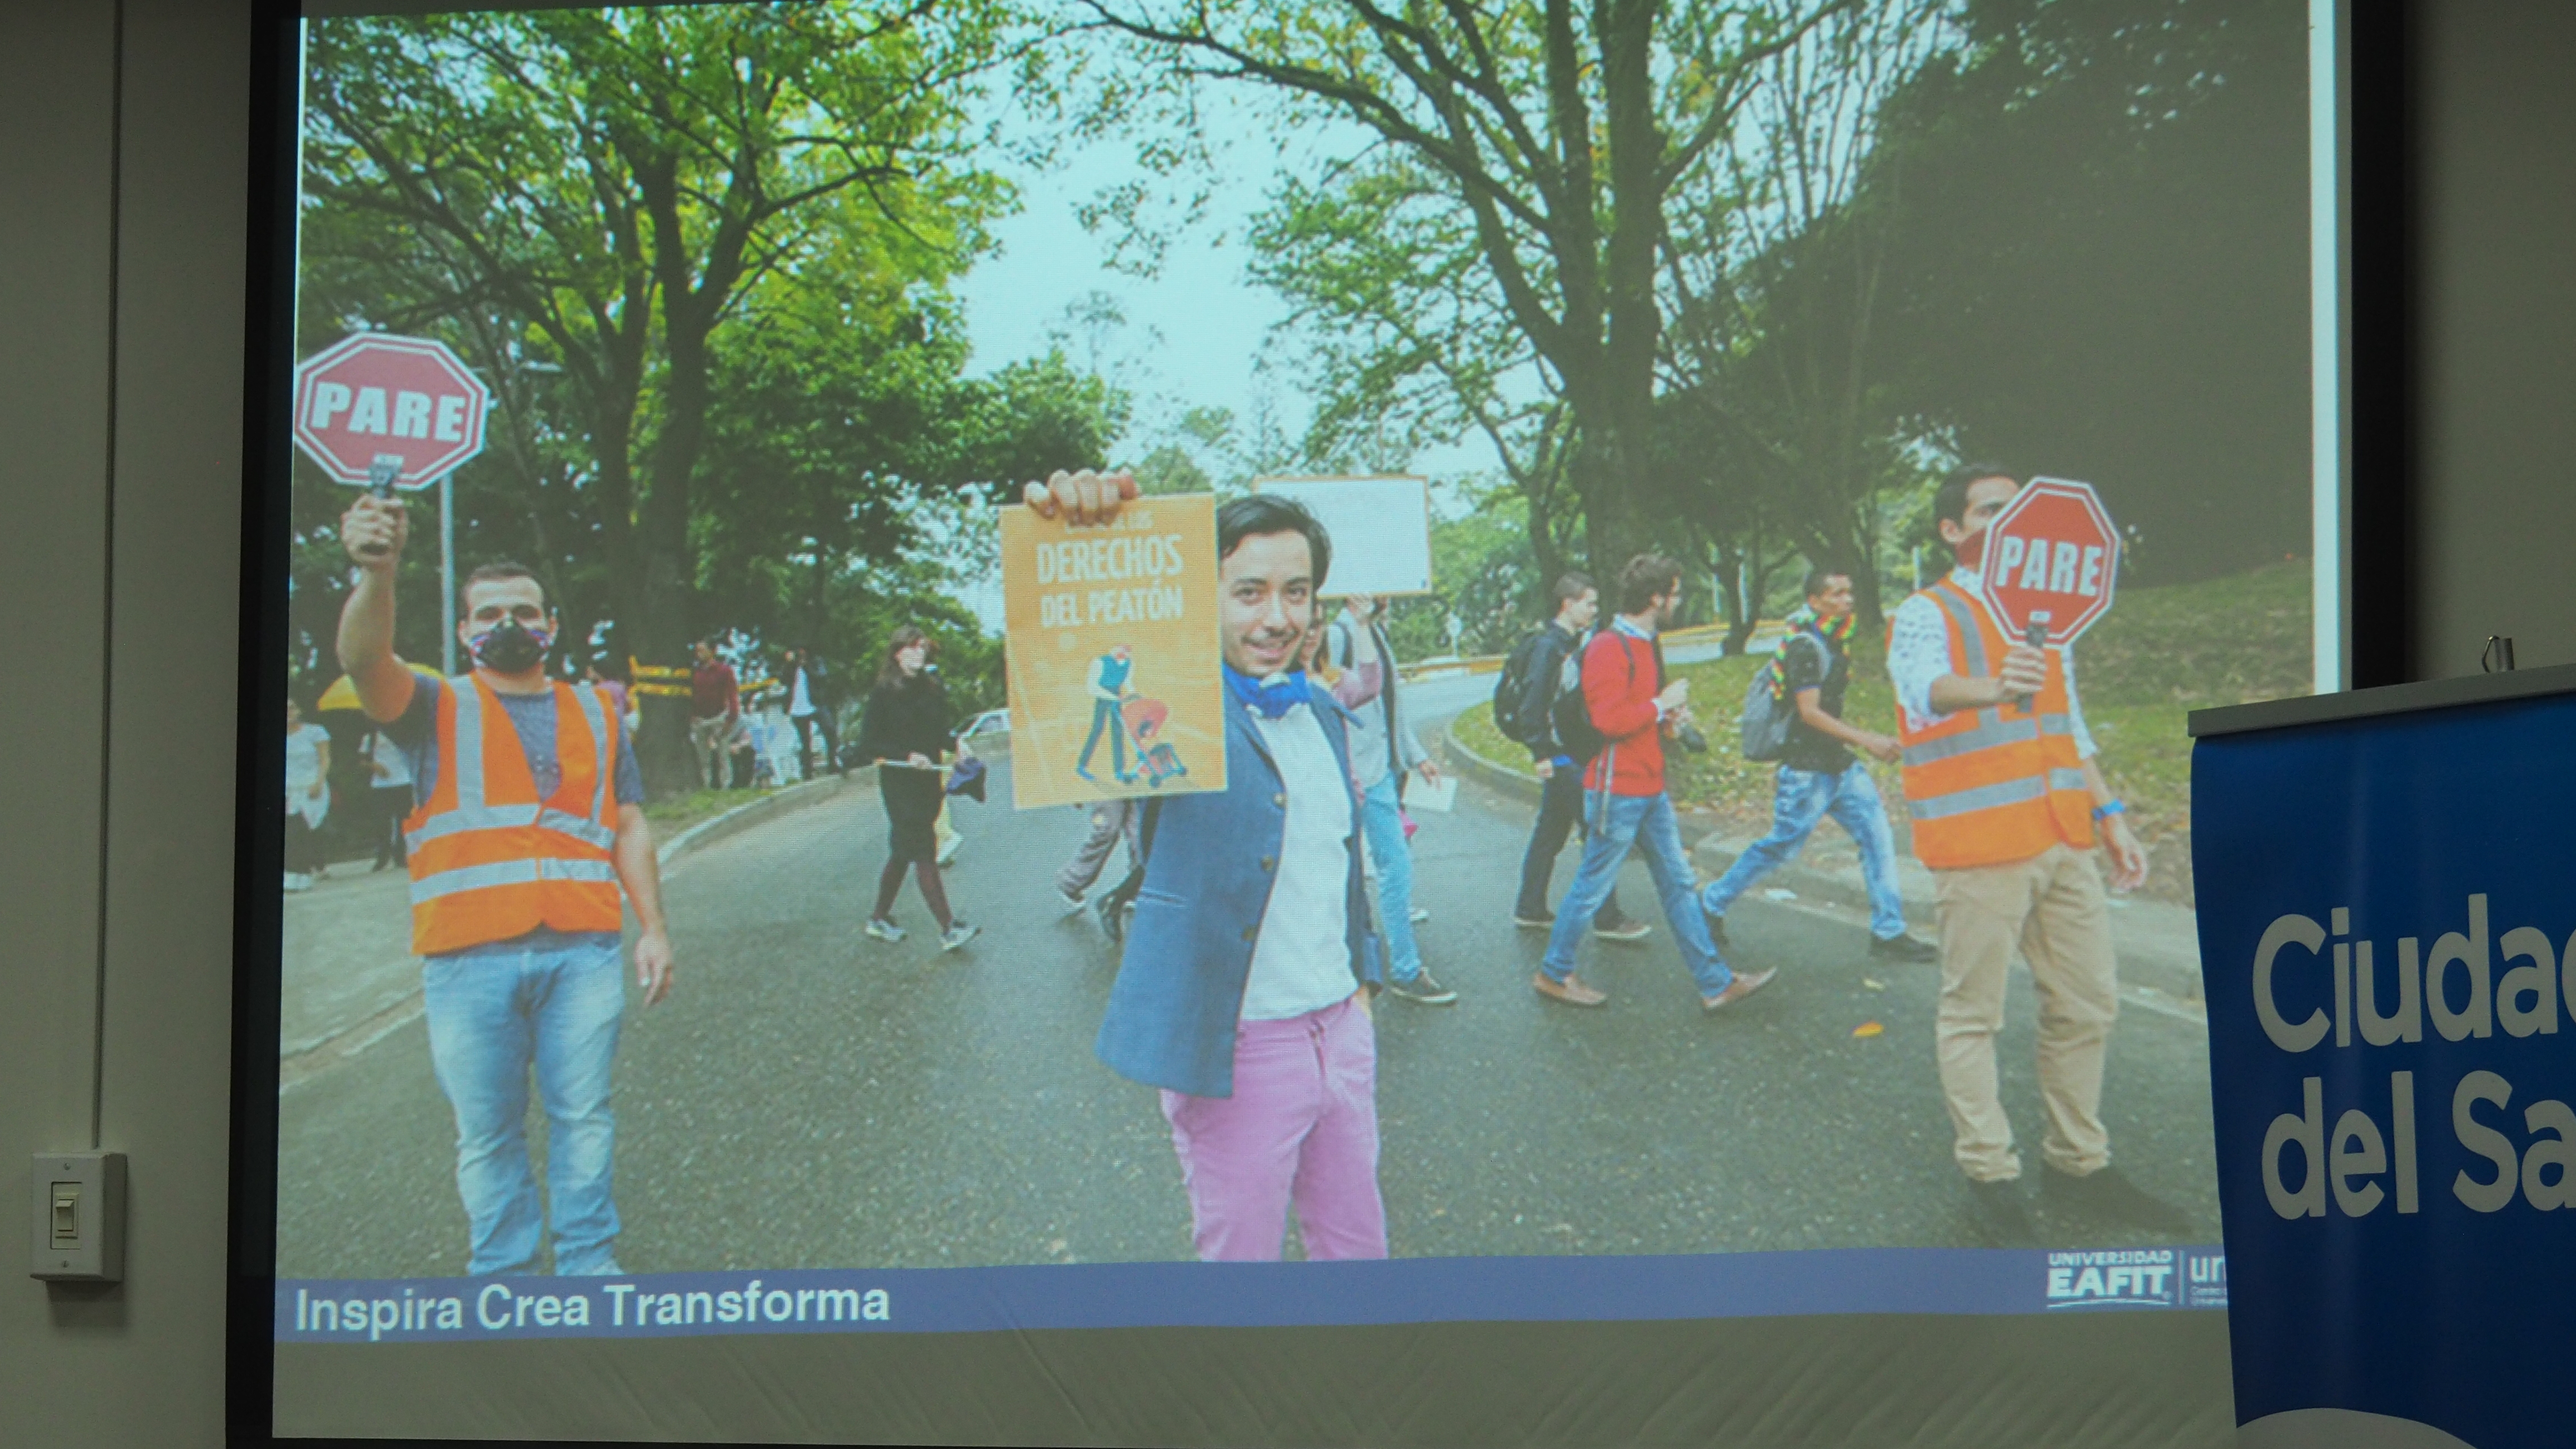
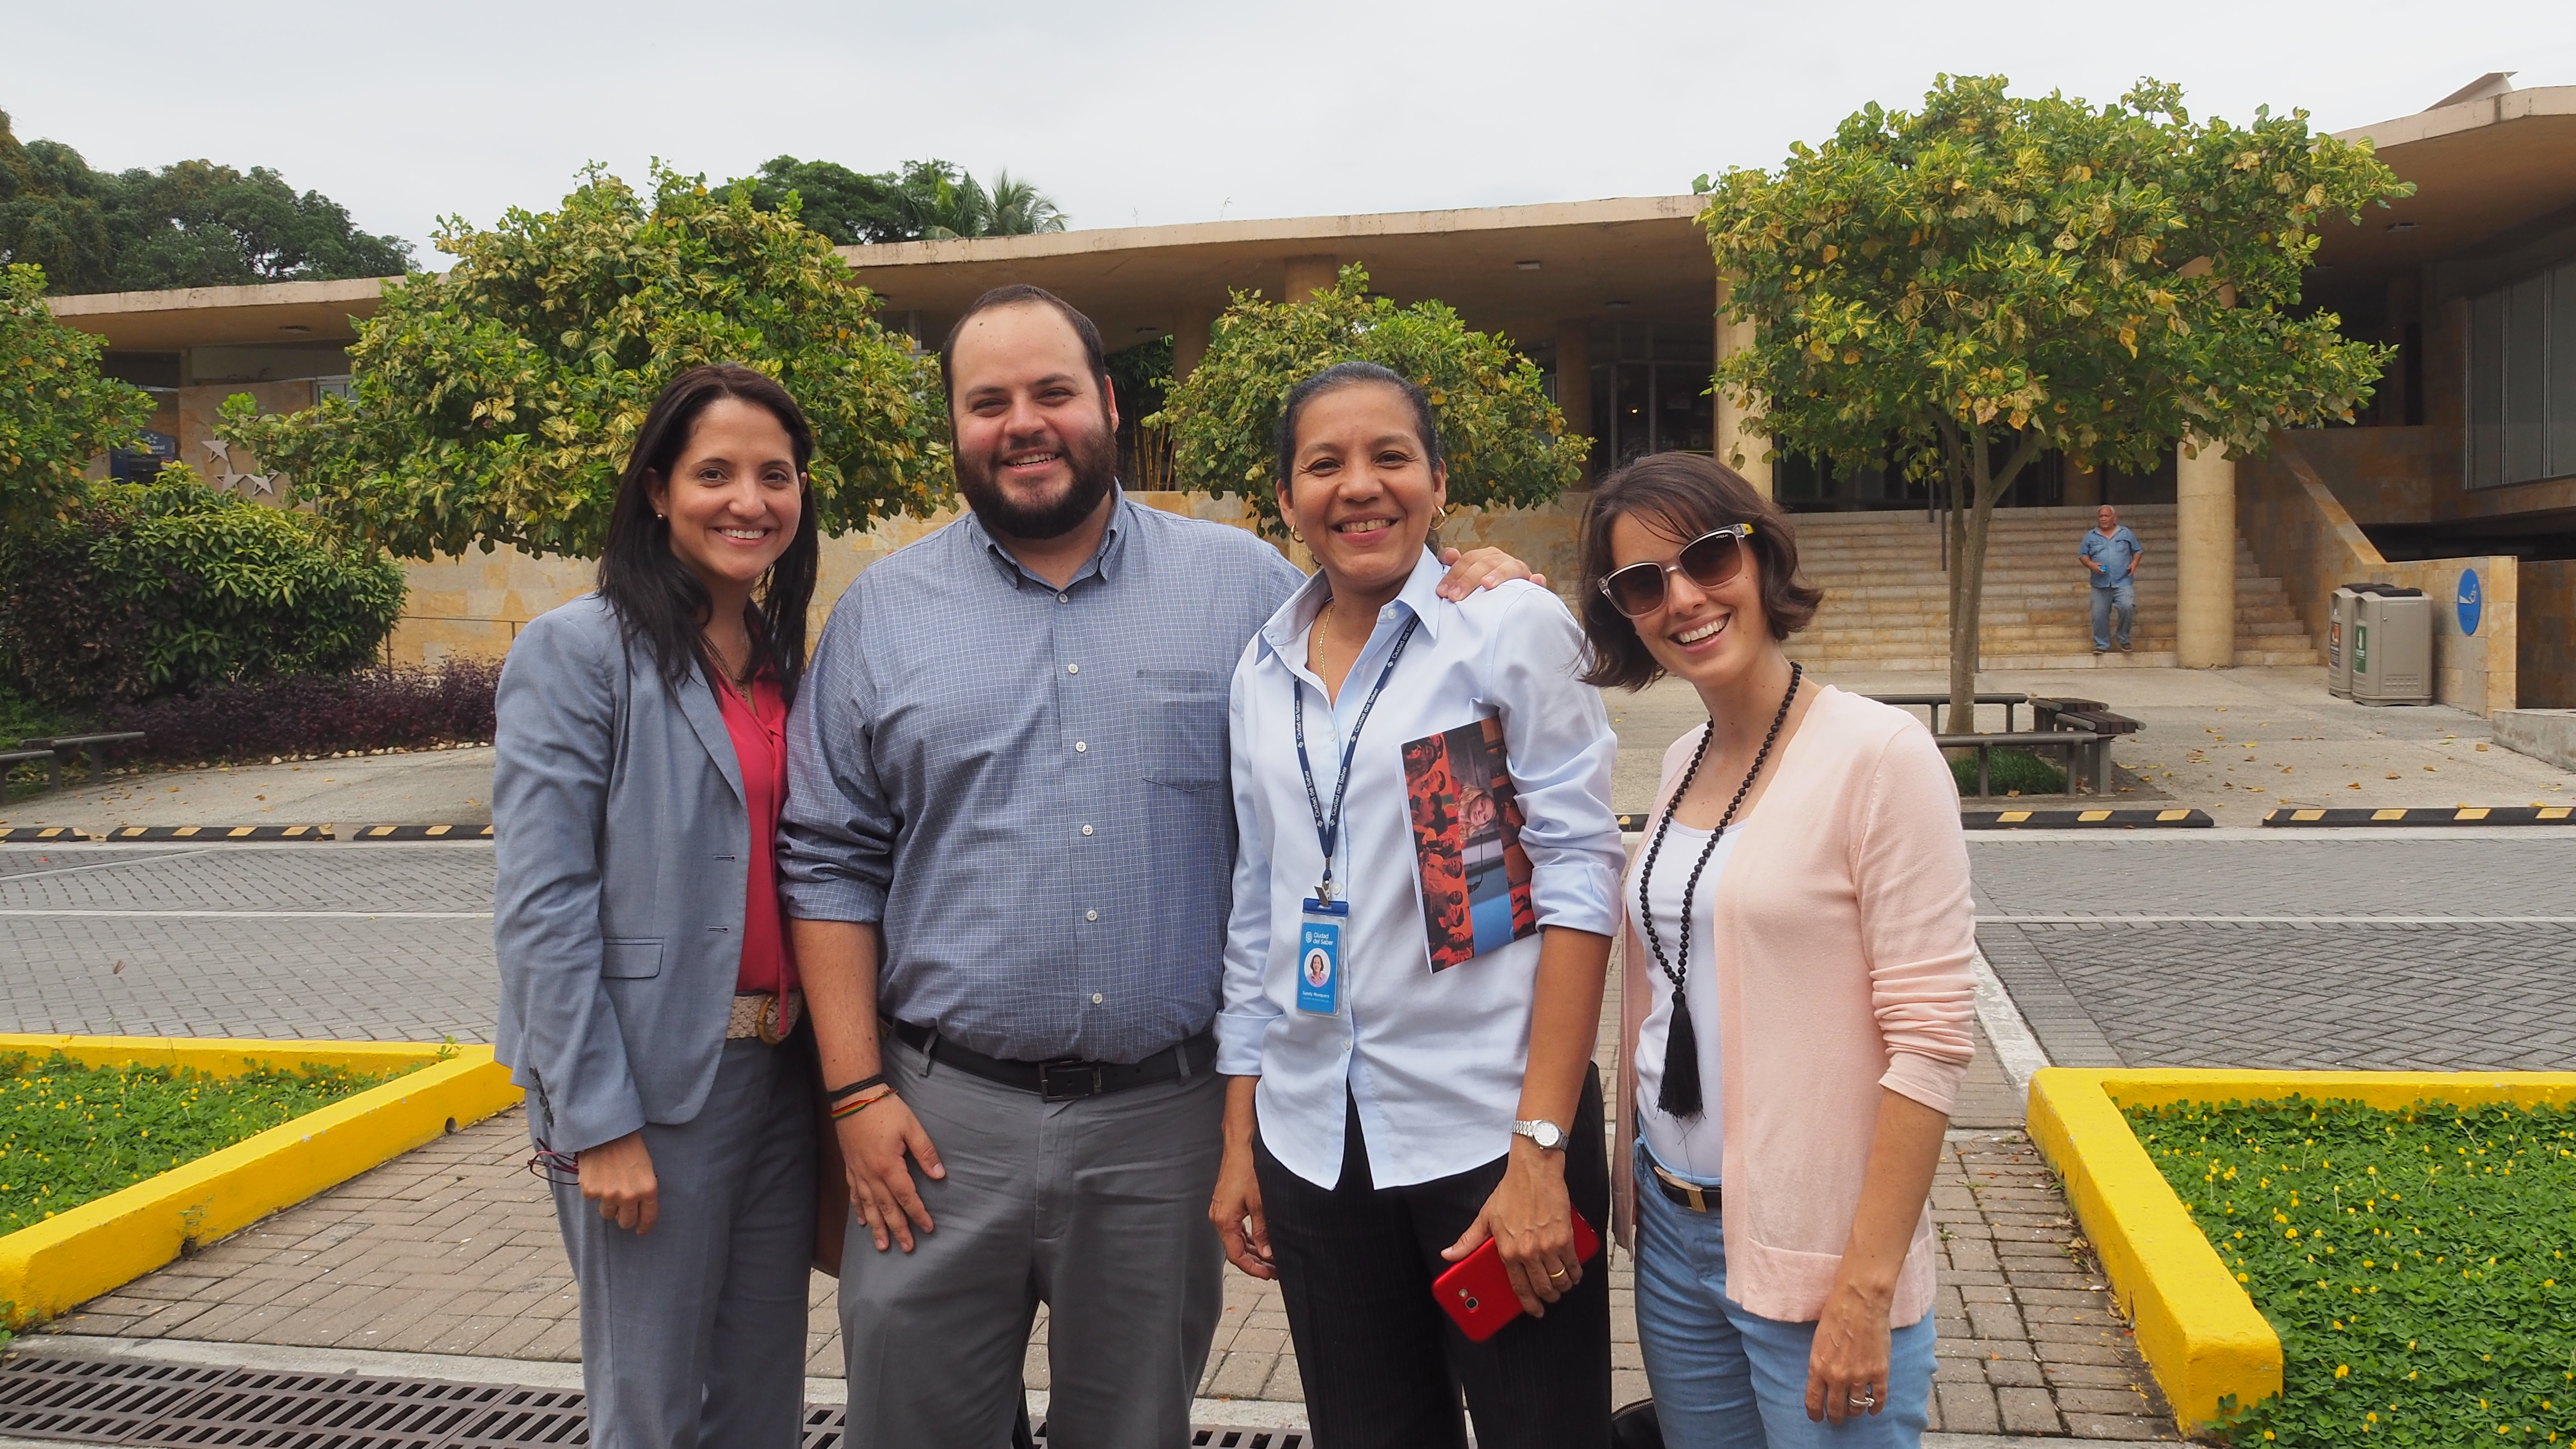
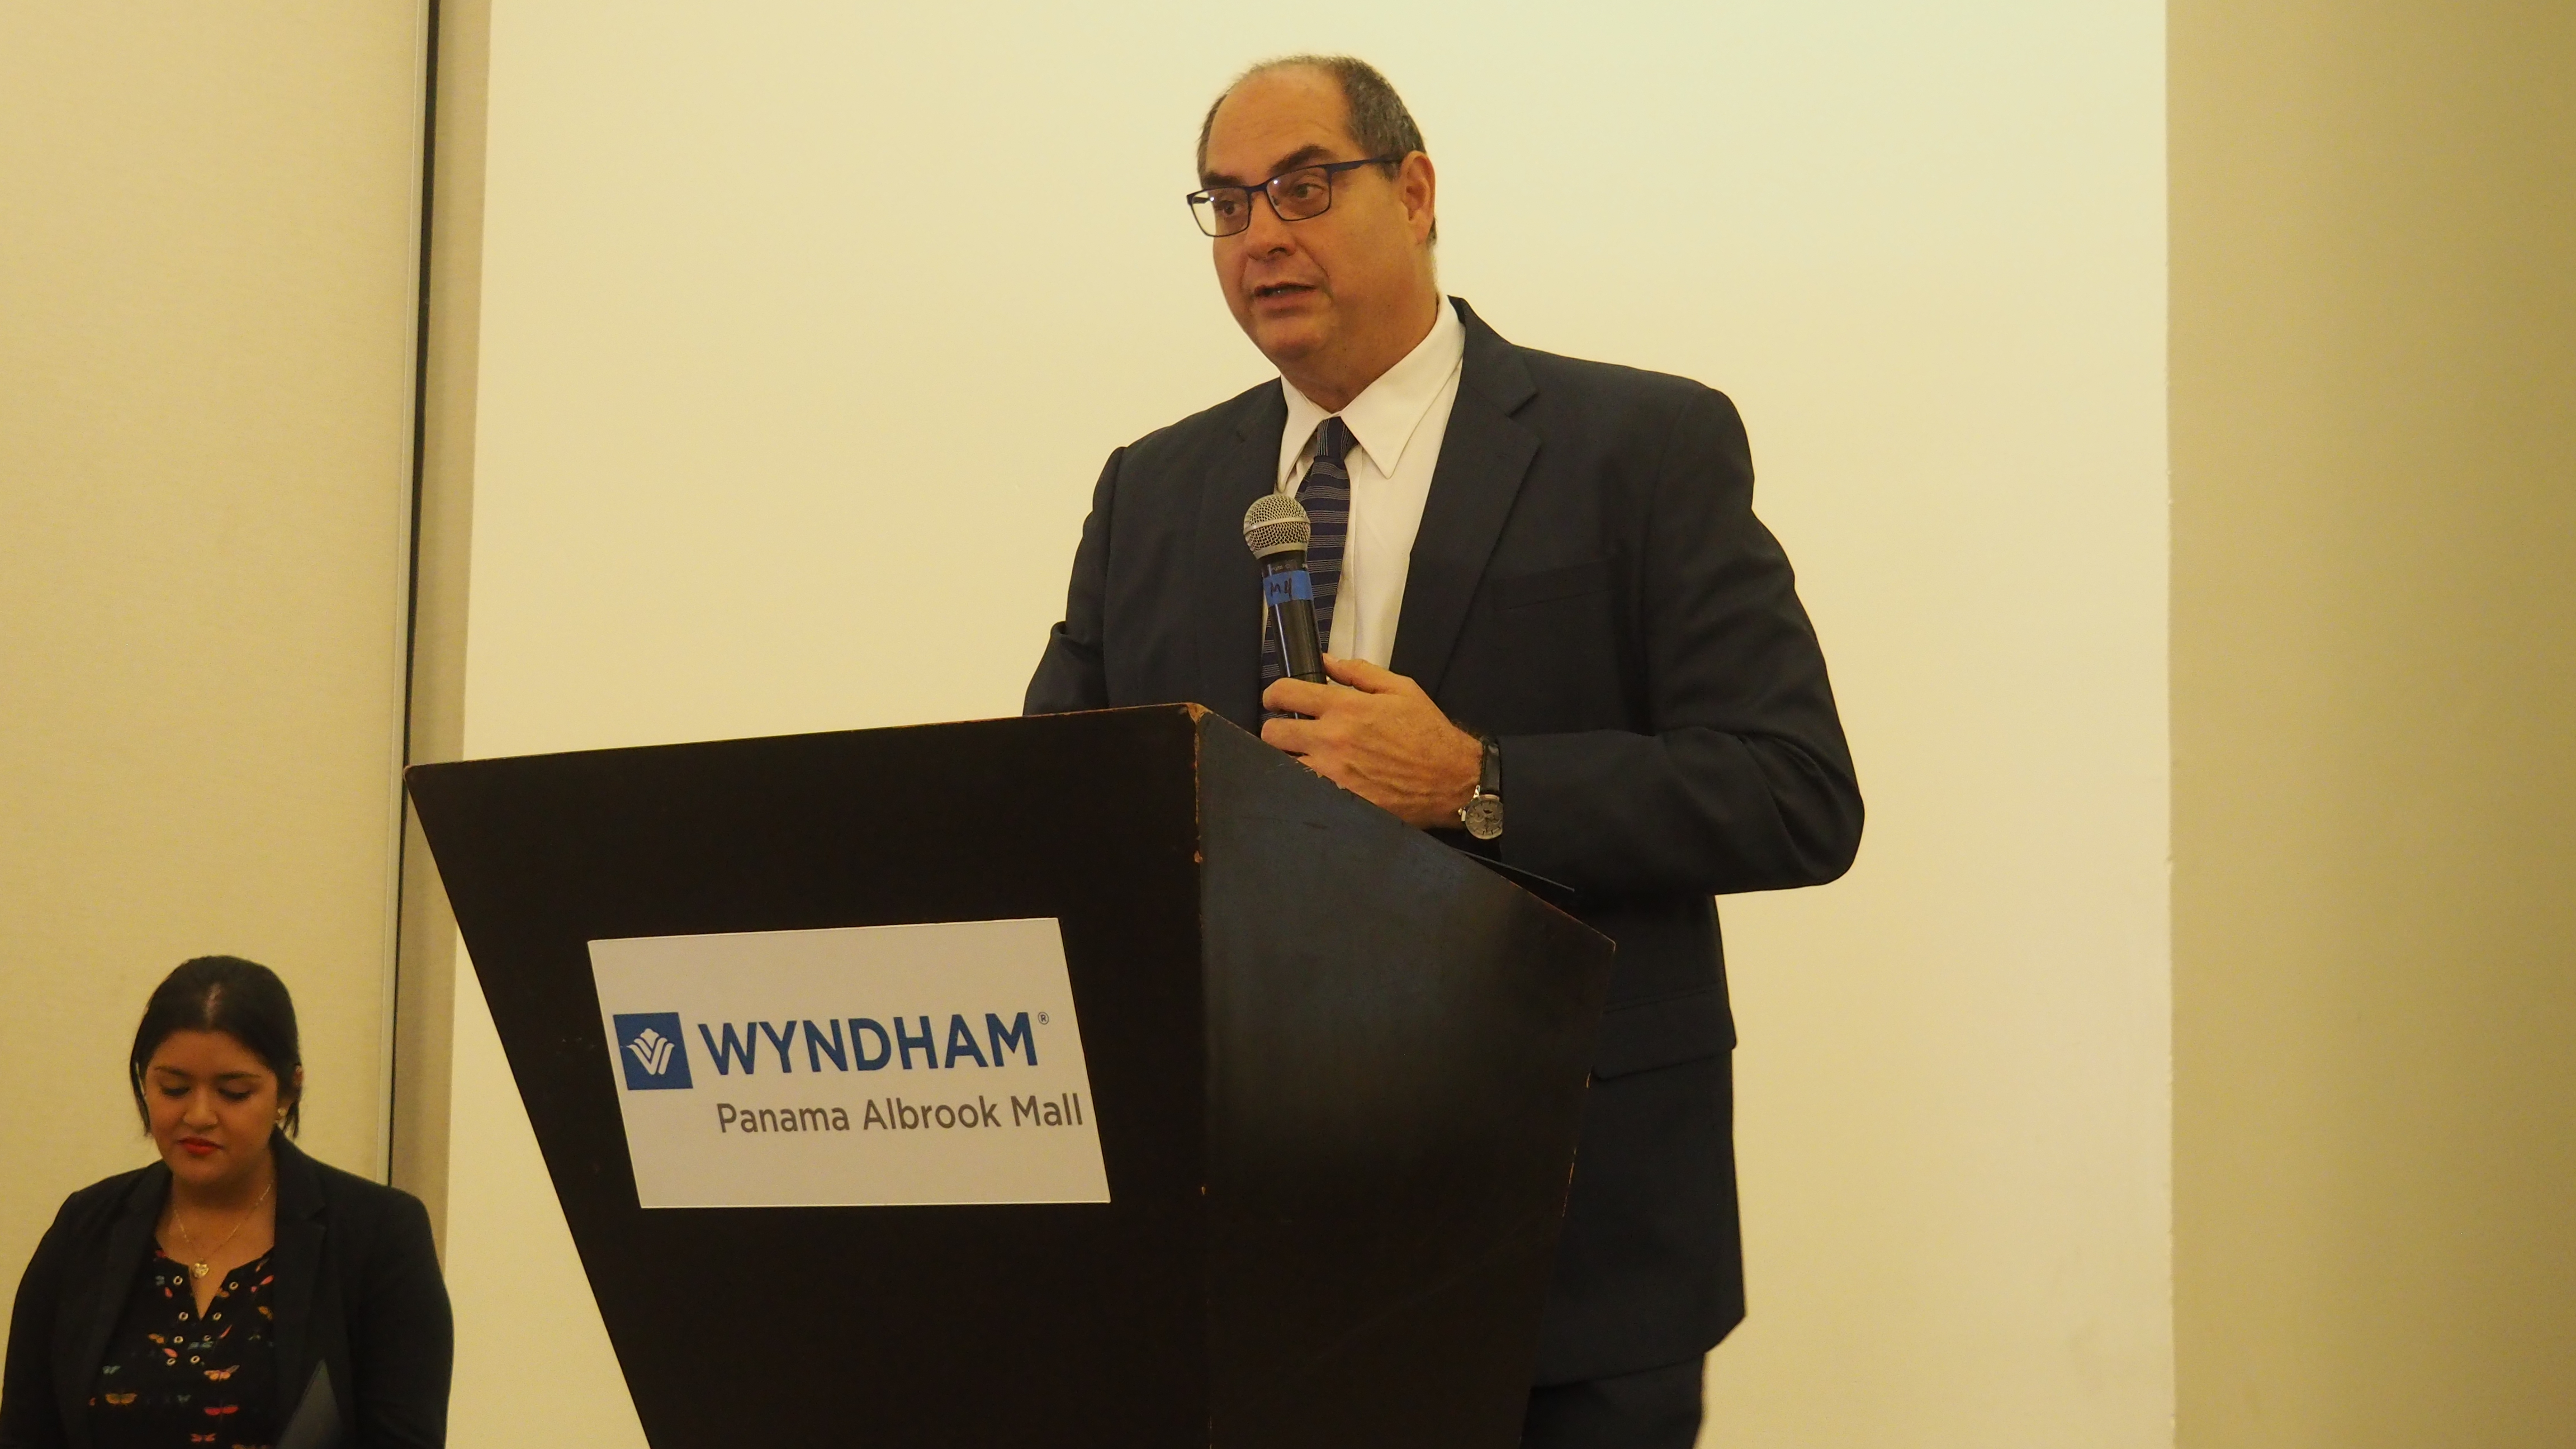
In the world of science reporting, researchers are rightly afraid of being misinterpreted — but journalists are equally frustrated by a lack of clear data to write their articles. One way to break the deadlock is to build trust and partnerships across the ‘media divide’. Partnerships based around data storytelling on everything from human survival to gender equality to environmental challenges. This was the key innovation of our third science reporting workshop, ‘Reach & Turn’, co-hosted in September 2017 with Panama’s City of Knowledge Foundation and the National Secretariat of Science, Technology and Innovation.
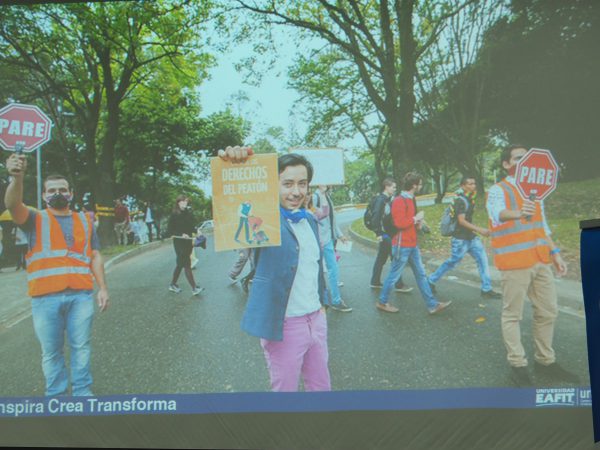
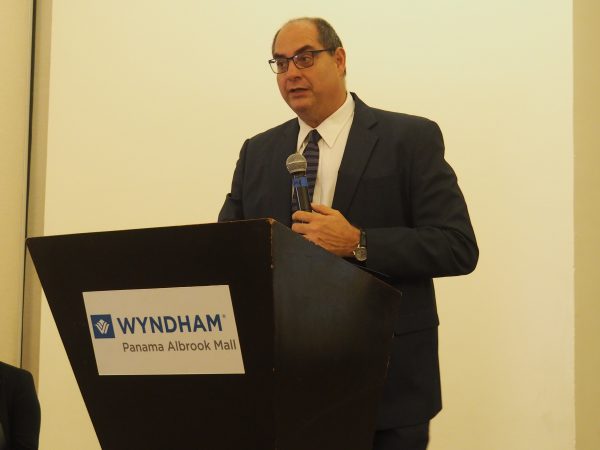
As in previous editions, the first day was led by colleagues from the United Nations University, including award-winning sustainability activist Prof. Carlos Cadena Gaitán. Using case studies from across Latin America, we looked at building bridges between the various actors in research, media and government, before explaining why evidence-based research is such a critical part of policymaking. To this end, we were joined by the Dutch Ambassador to Panama, Dirk Janssen — himself an alumnus of Maastricht University:
Discutiendo Twiplomacy con 40 periodistas y cientificos de 🇵🇦 y 🇨🇴. Desafio compartido: comunicar sobre cosas complejas con pocas palabras. pic.twitter.com/LKNAsYaw2i
— Dirk Janssen (@dirkjanjanssen) September 14, 2017
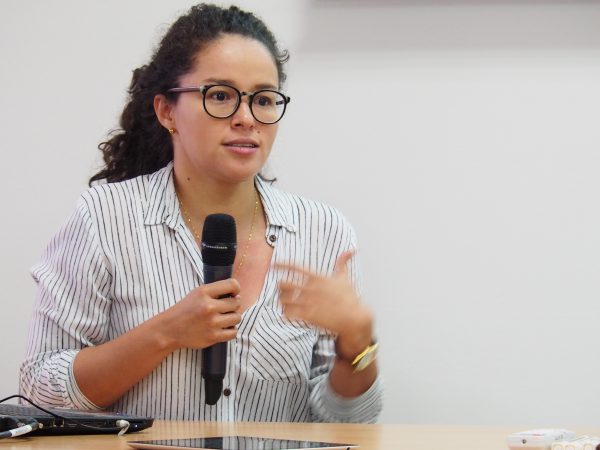
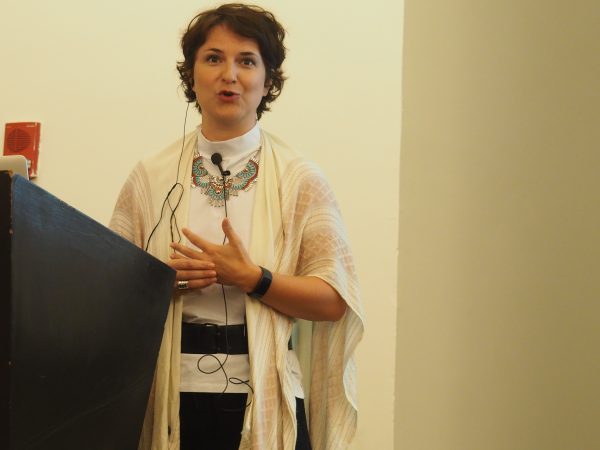
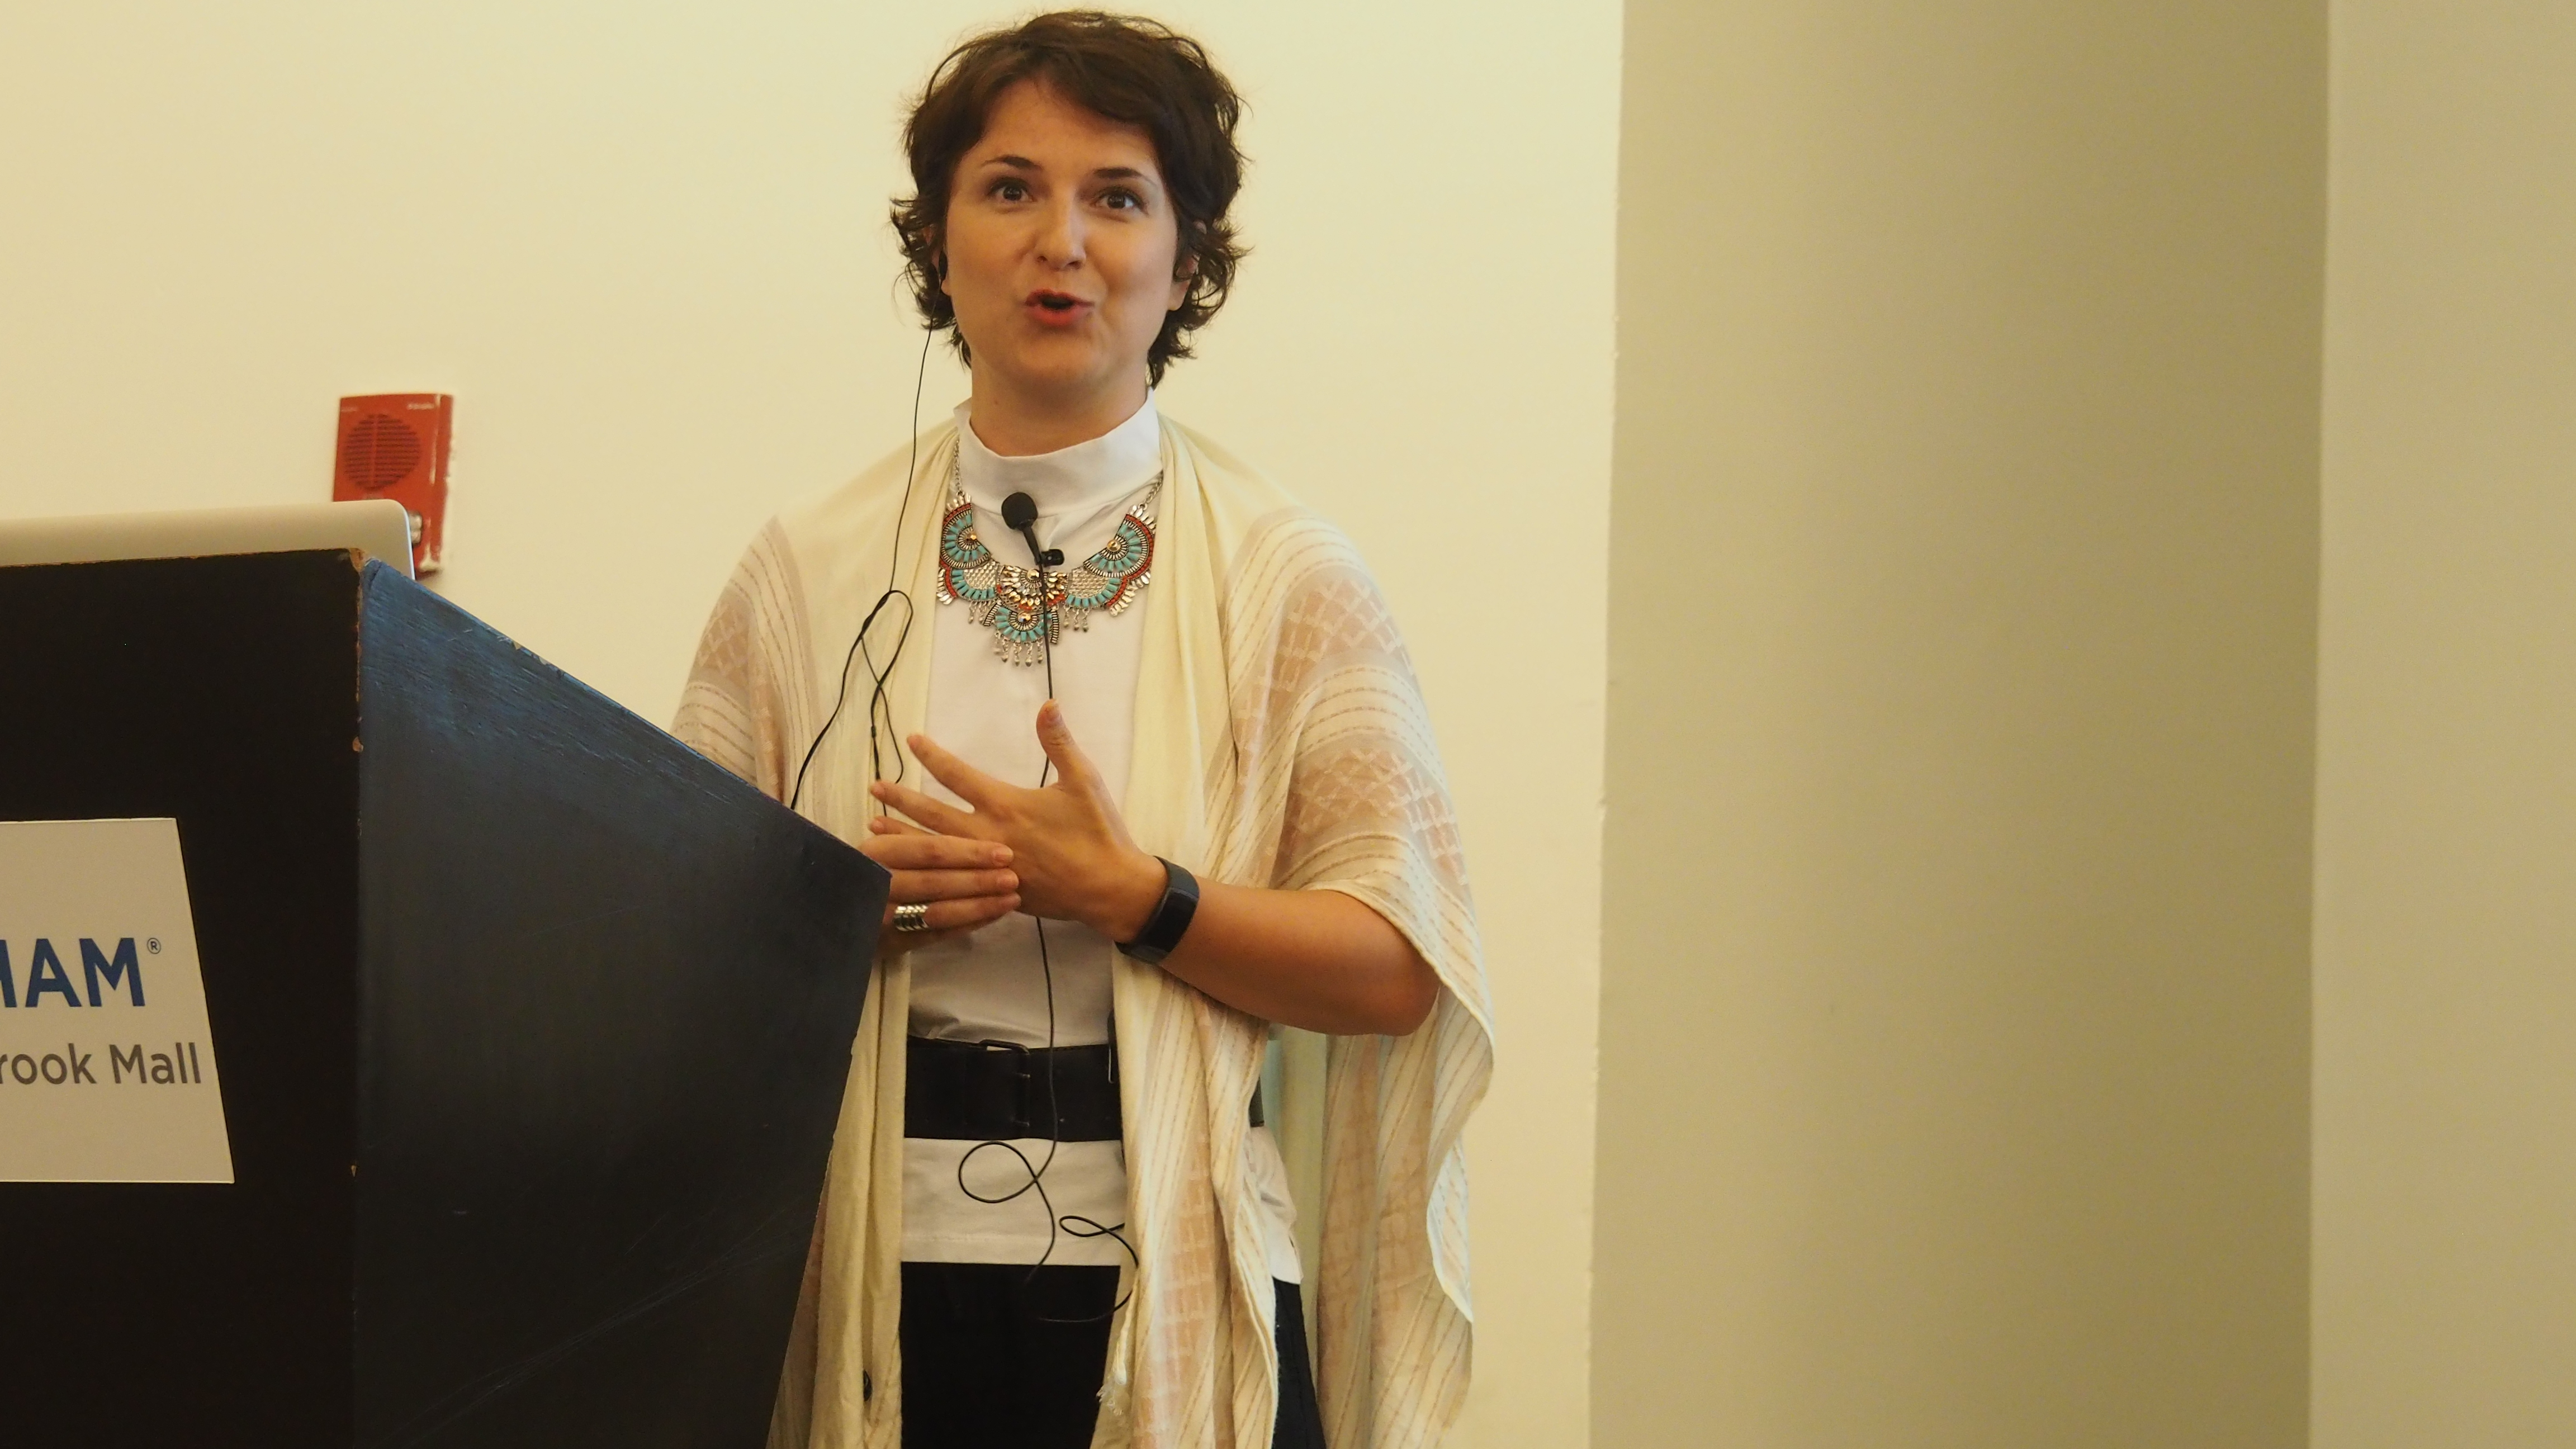
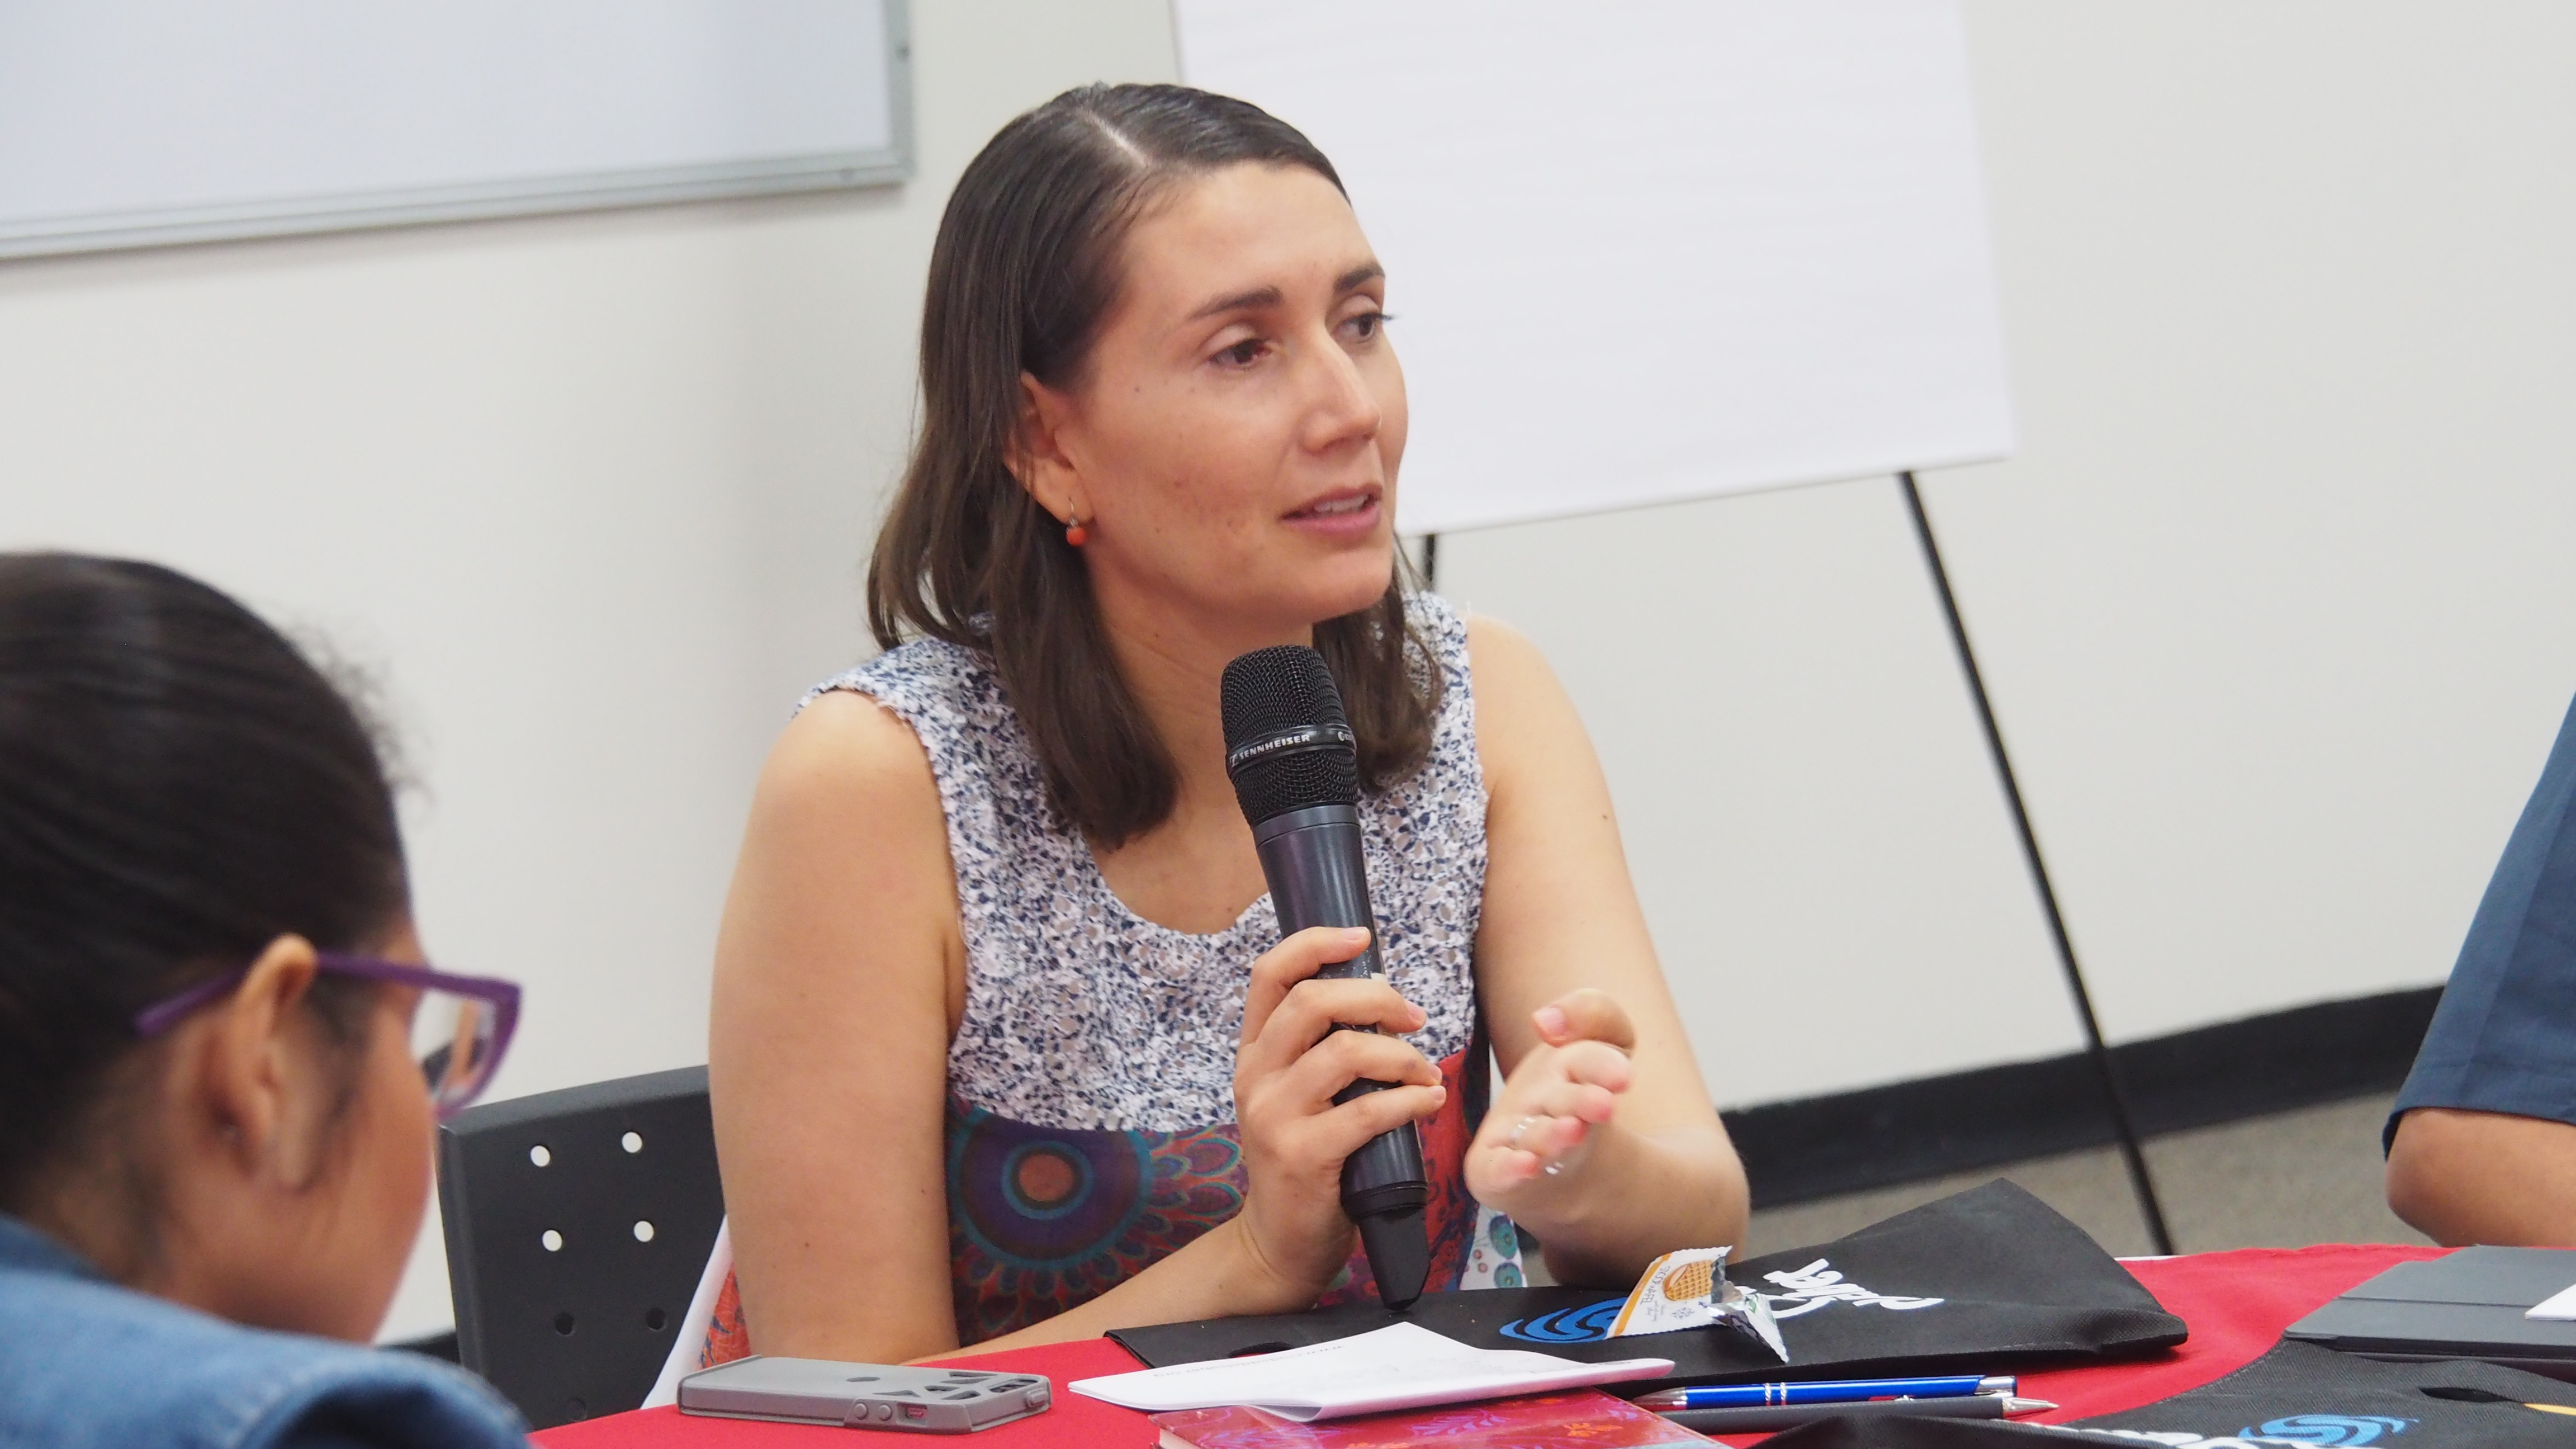
Our second and third days were led by award-winning digital media producer Lily Ciric Hoffmann. She opened with an article by UNU PhD fellow Lorena Rivera León, which asked participants to weigh up not only the gender perspective but also the sources of data:
Women aren’t failing at science — science is failing women, https://t.co/lSR7VduRA3 #ReachAndTurn
— Lily Ciric Hoffmann (@lilyciric) September 15, 2017
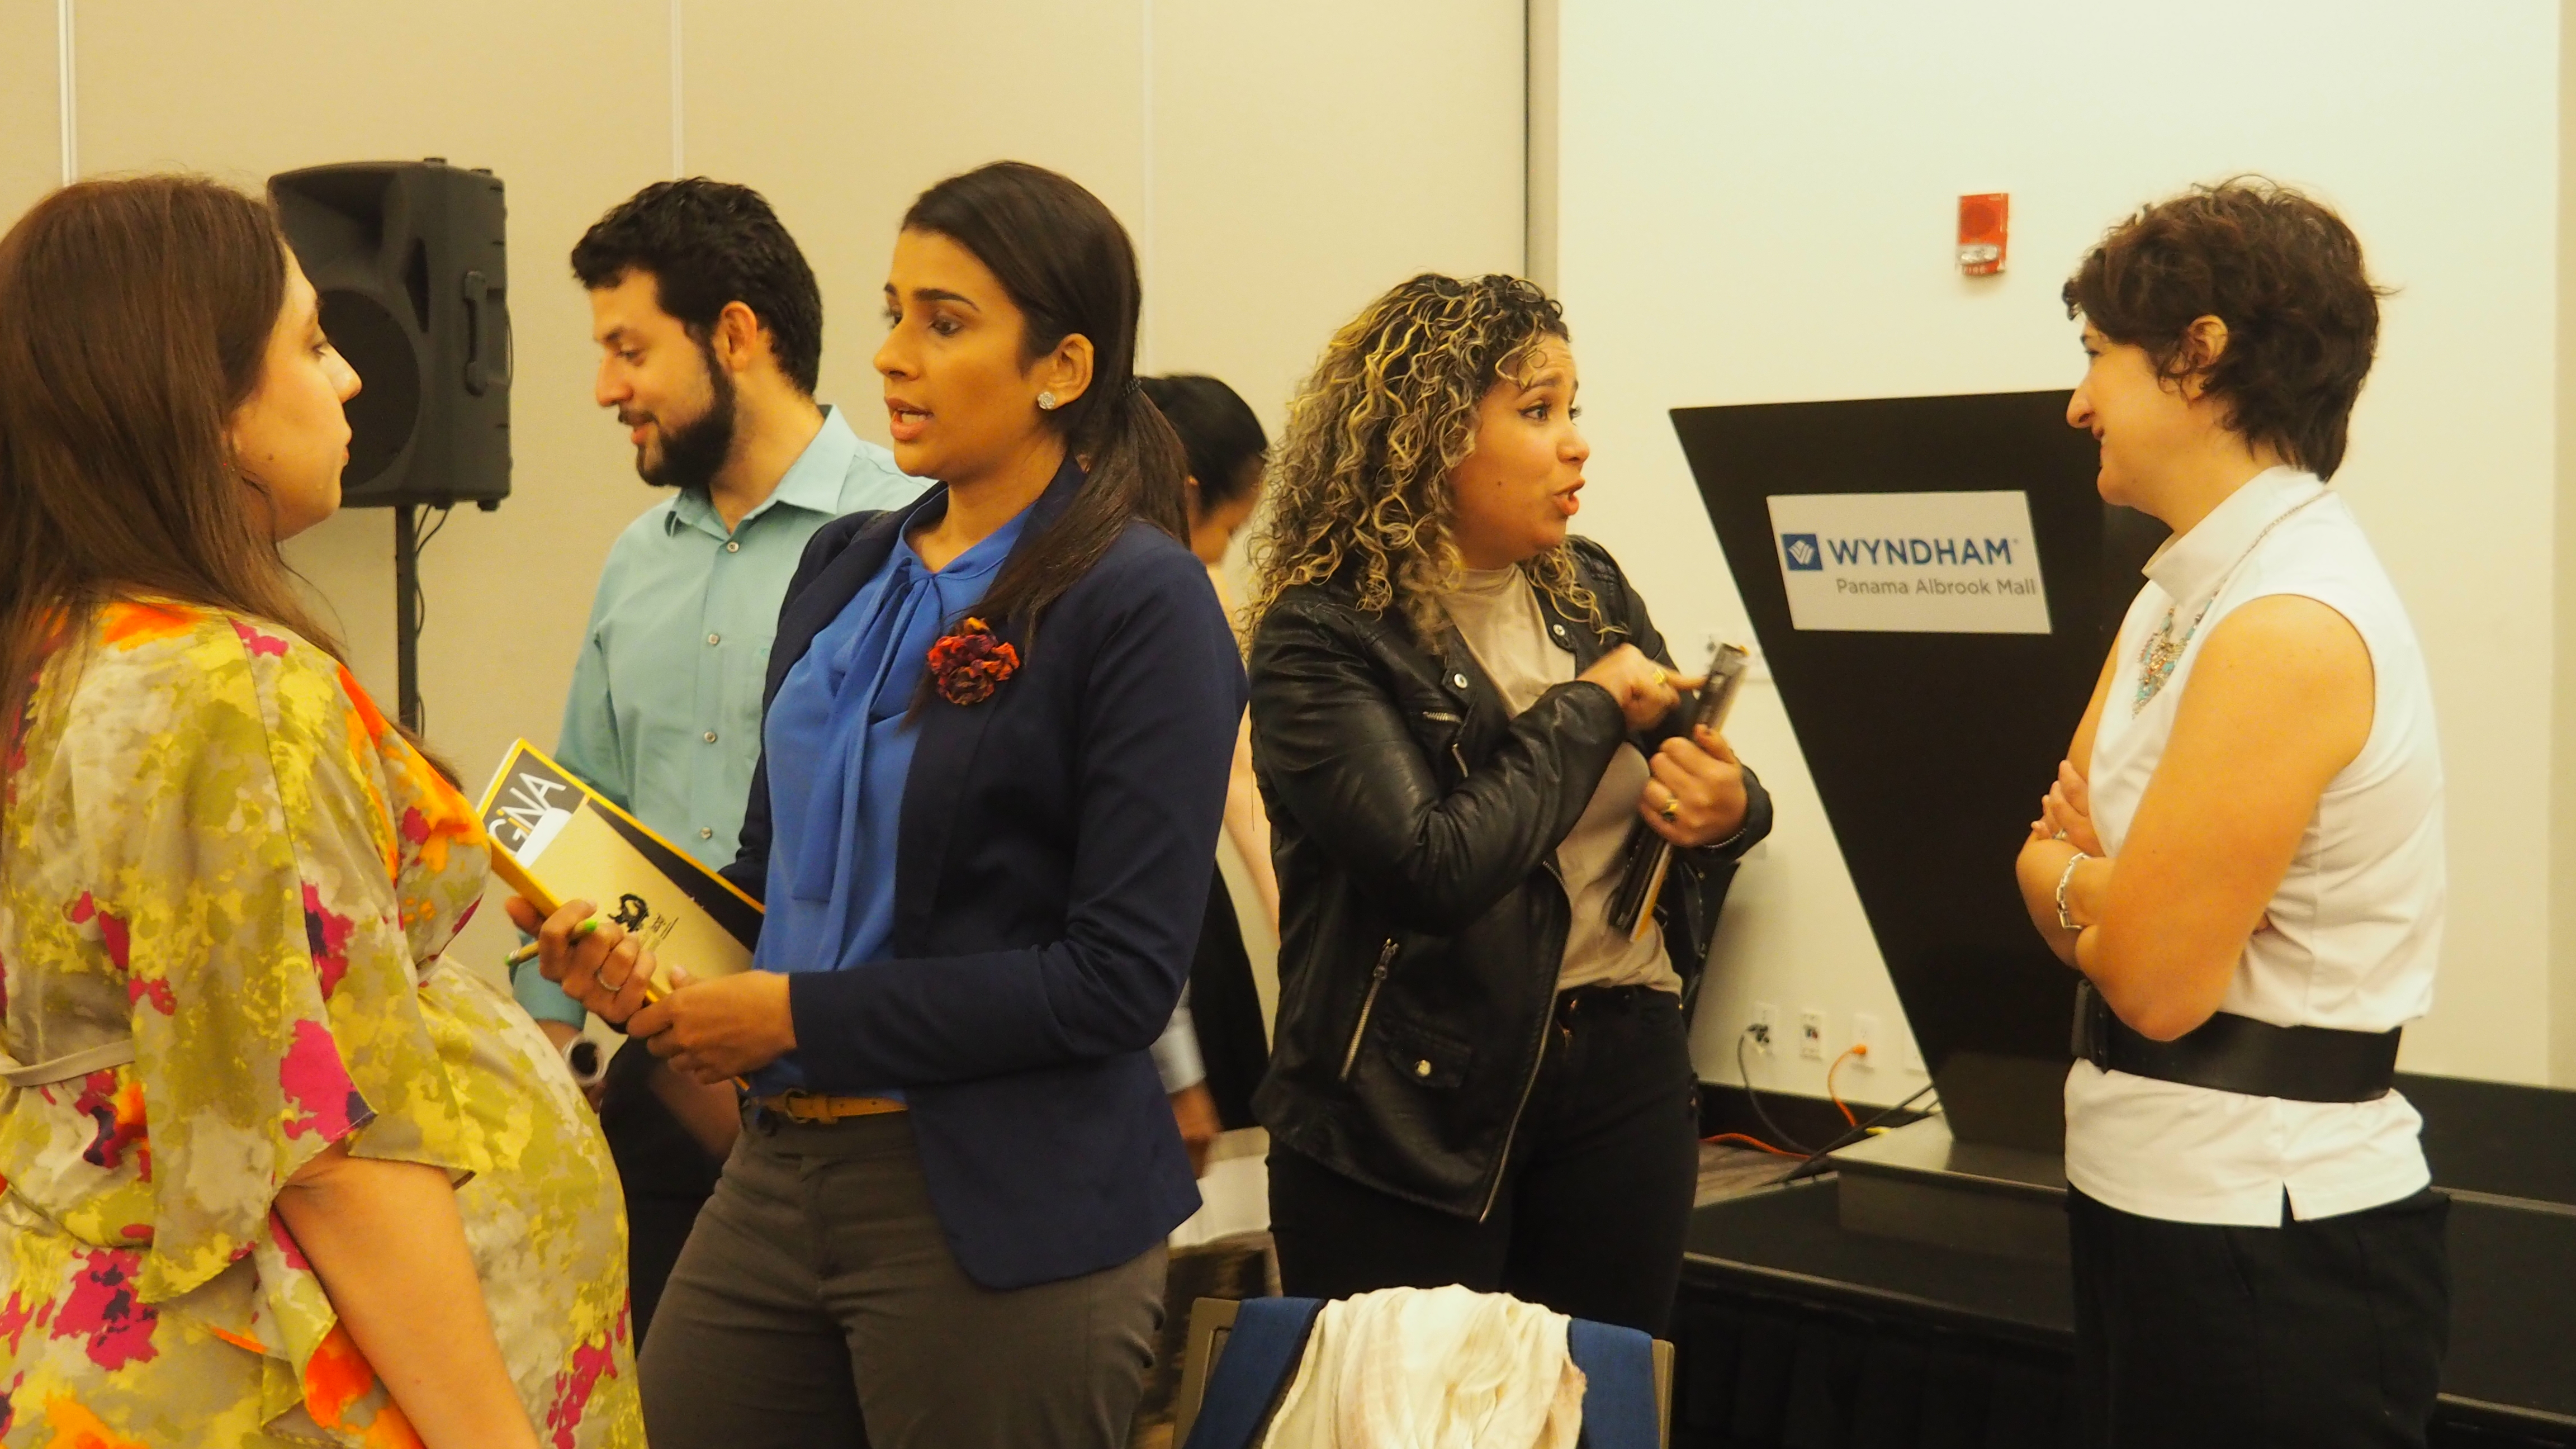
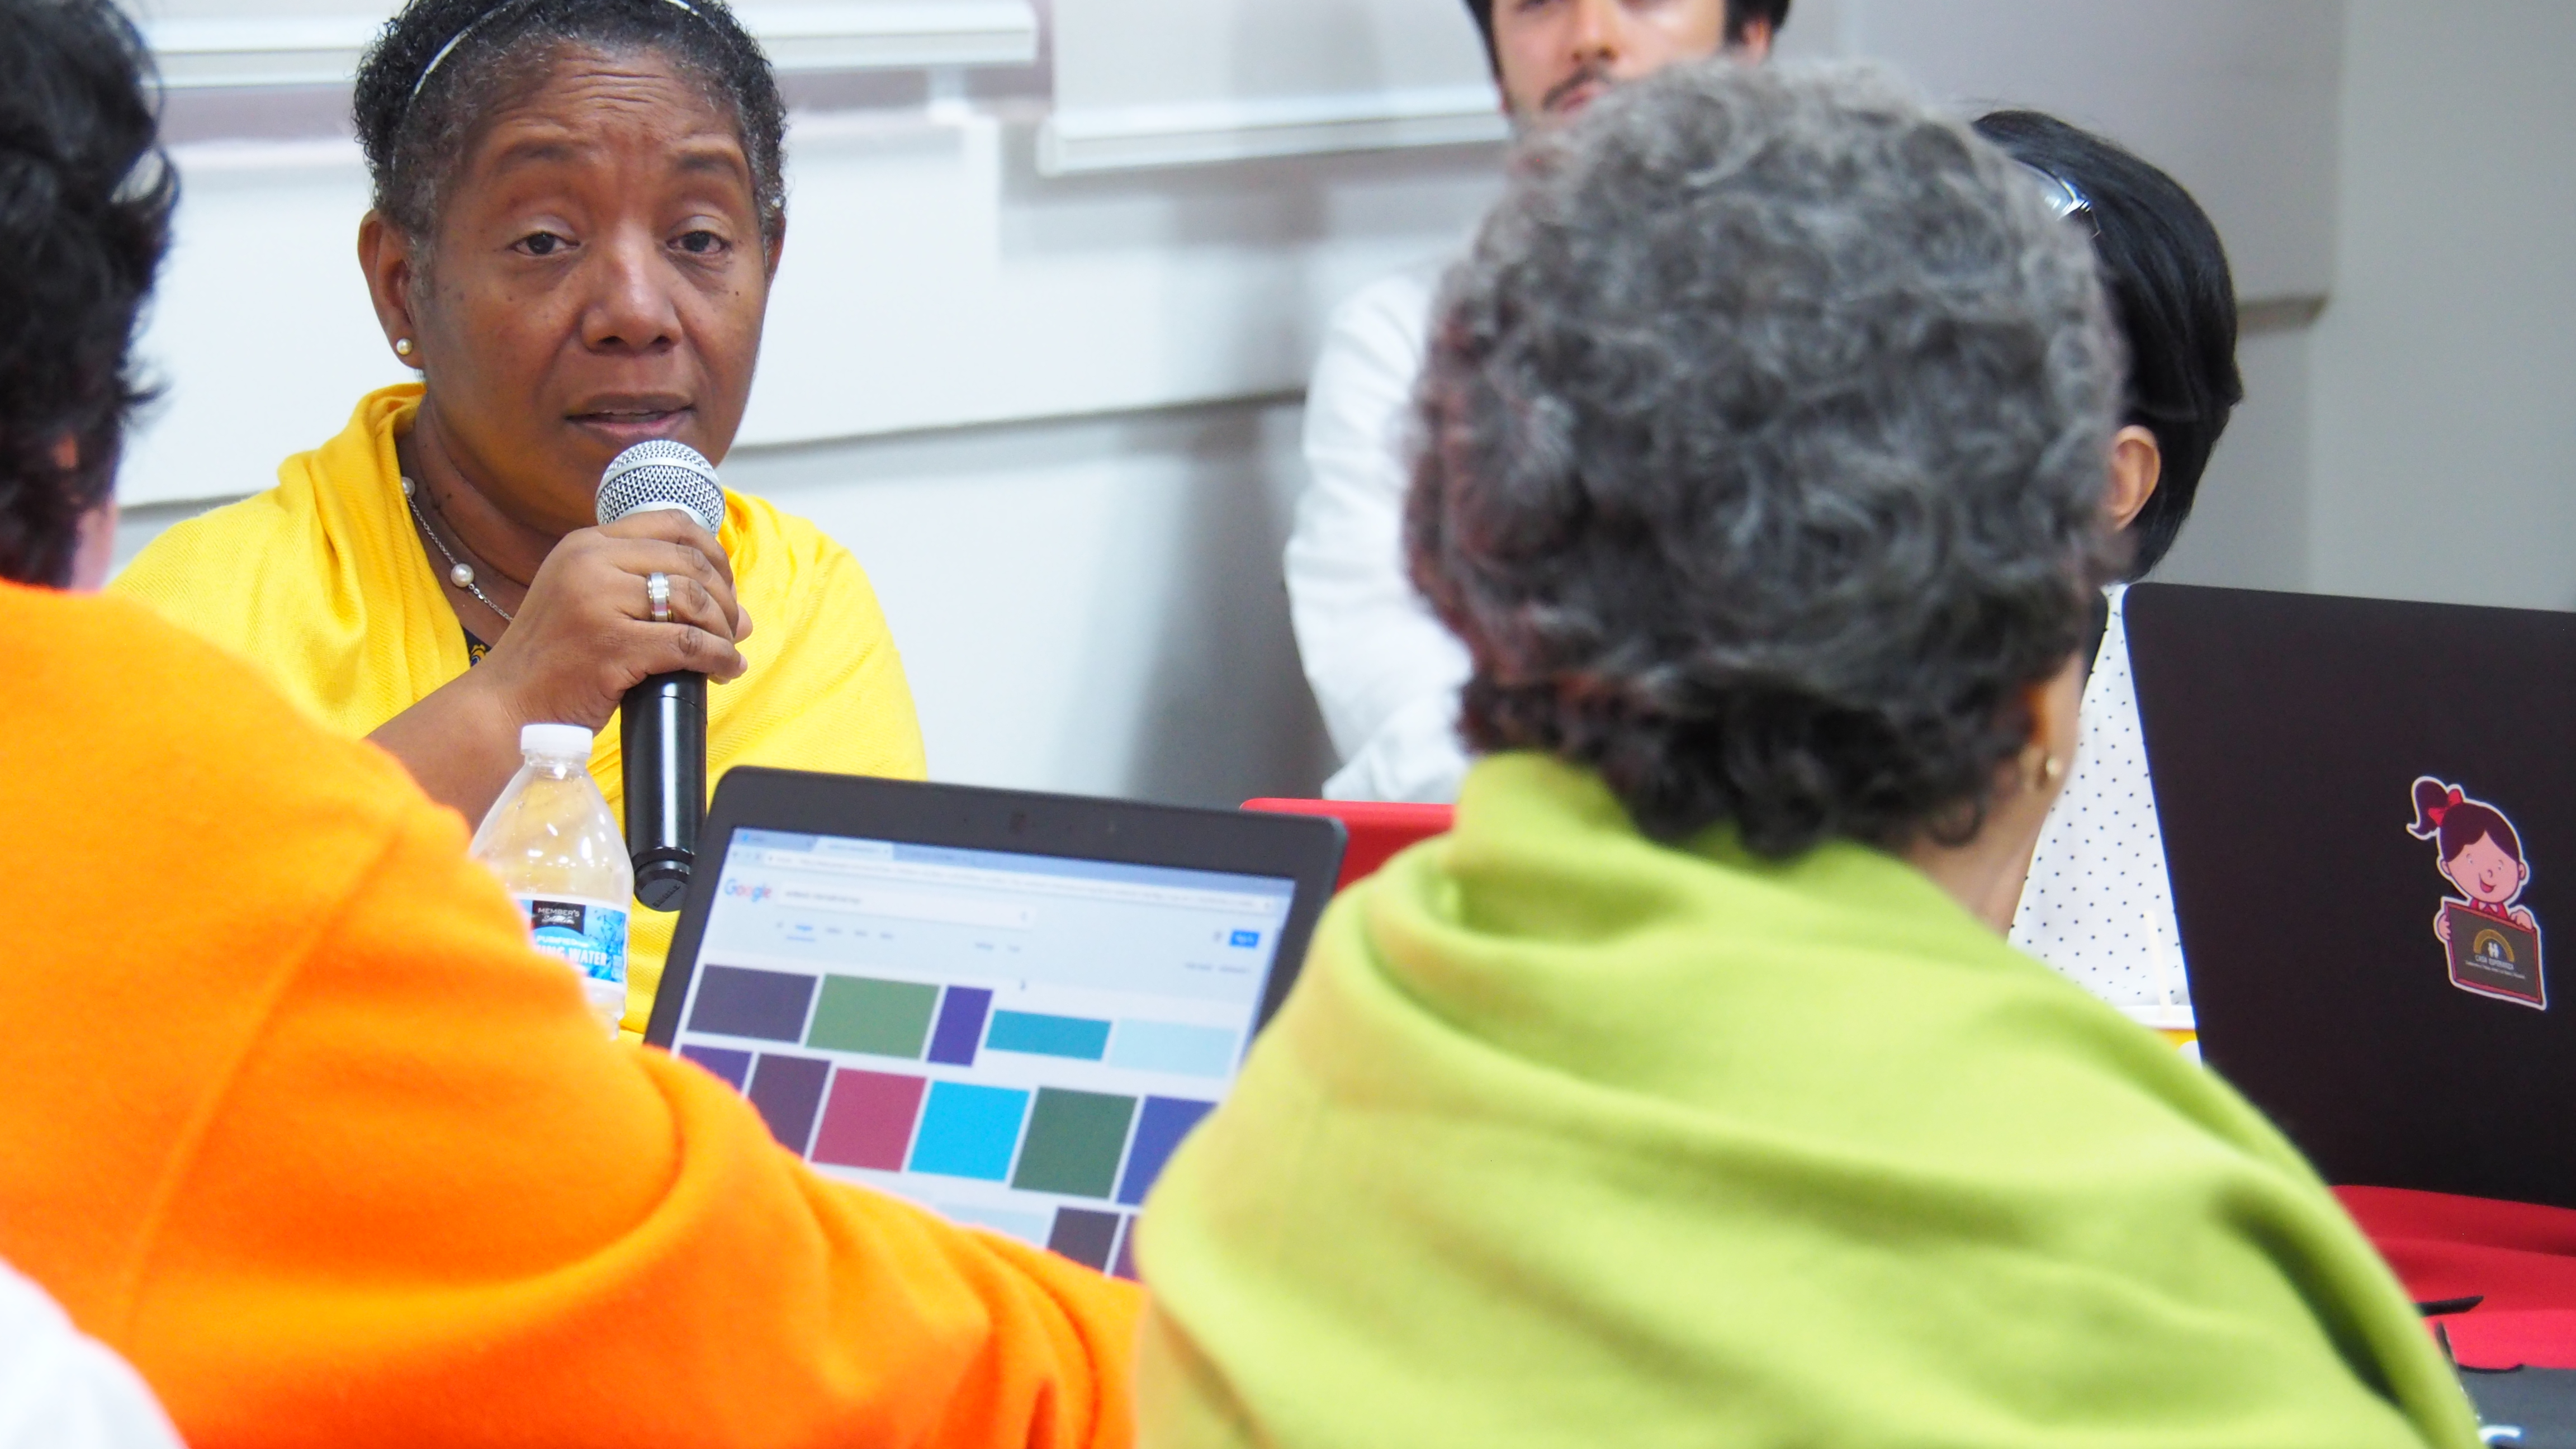
The audience — around one-third researchers and two-thirds journalists — then moved on to a number of practical, interactive exercises on finding, processing and displaying data. The chosen topics demonstrated how informing the public needs to be a collaborative effort: i.e. scientists do the research and come up with data and theories, and then journalists communicate the findings and meaning to the general public.
The groups worked together, challenged each other, sparked discussions, and shared both frustrations and success stories. Participants welcomed the non-judgmental and open dialogue, demonstrating in real-time how checks and balances are so critical to the data storytelling process. During the day, the groups collaborated on a story of their choice supported by data, and each team gave a presentation about their topic on the closing day.
Essentially, communicating data in a clear and concise way to the public is always challenging, but when done correctly it can be a powerful and engaging storytelling tool. The key, as ever in communications, is to know and understand your audience.
Data-rich tools
 Participants looked at and discussed examples of long form, interactive, data rich, science storytelling pieces. They were shown free-to-use data visualisation tools such as Infogram, Silk.co and Canva and experimented using the tools. Infogram proved to be the most popular tool for the participants, as the majority started using it to create infographics. At the end of the session, the groups discussed ways of augmenting a science article with data visualisations – to make the claims, observations, and overall story crystal clear.
In the second session, participants were shown different types of data visualisations and how to choose the right one for their particular story. Groups looked at examples and discussed when it’s appropriate to use bar, column and pie charts, infographics, interactive maps, and timelines. They experimented some more with the data tools and played with the different data visualisation types.
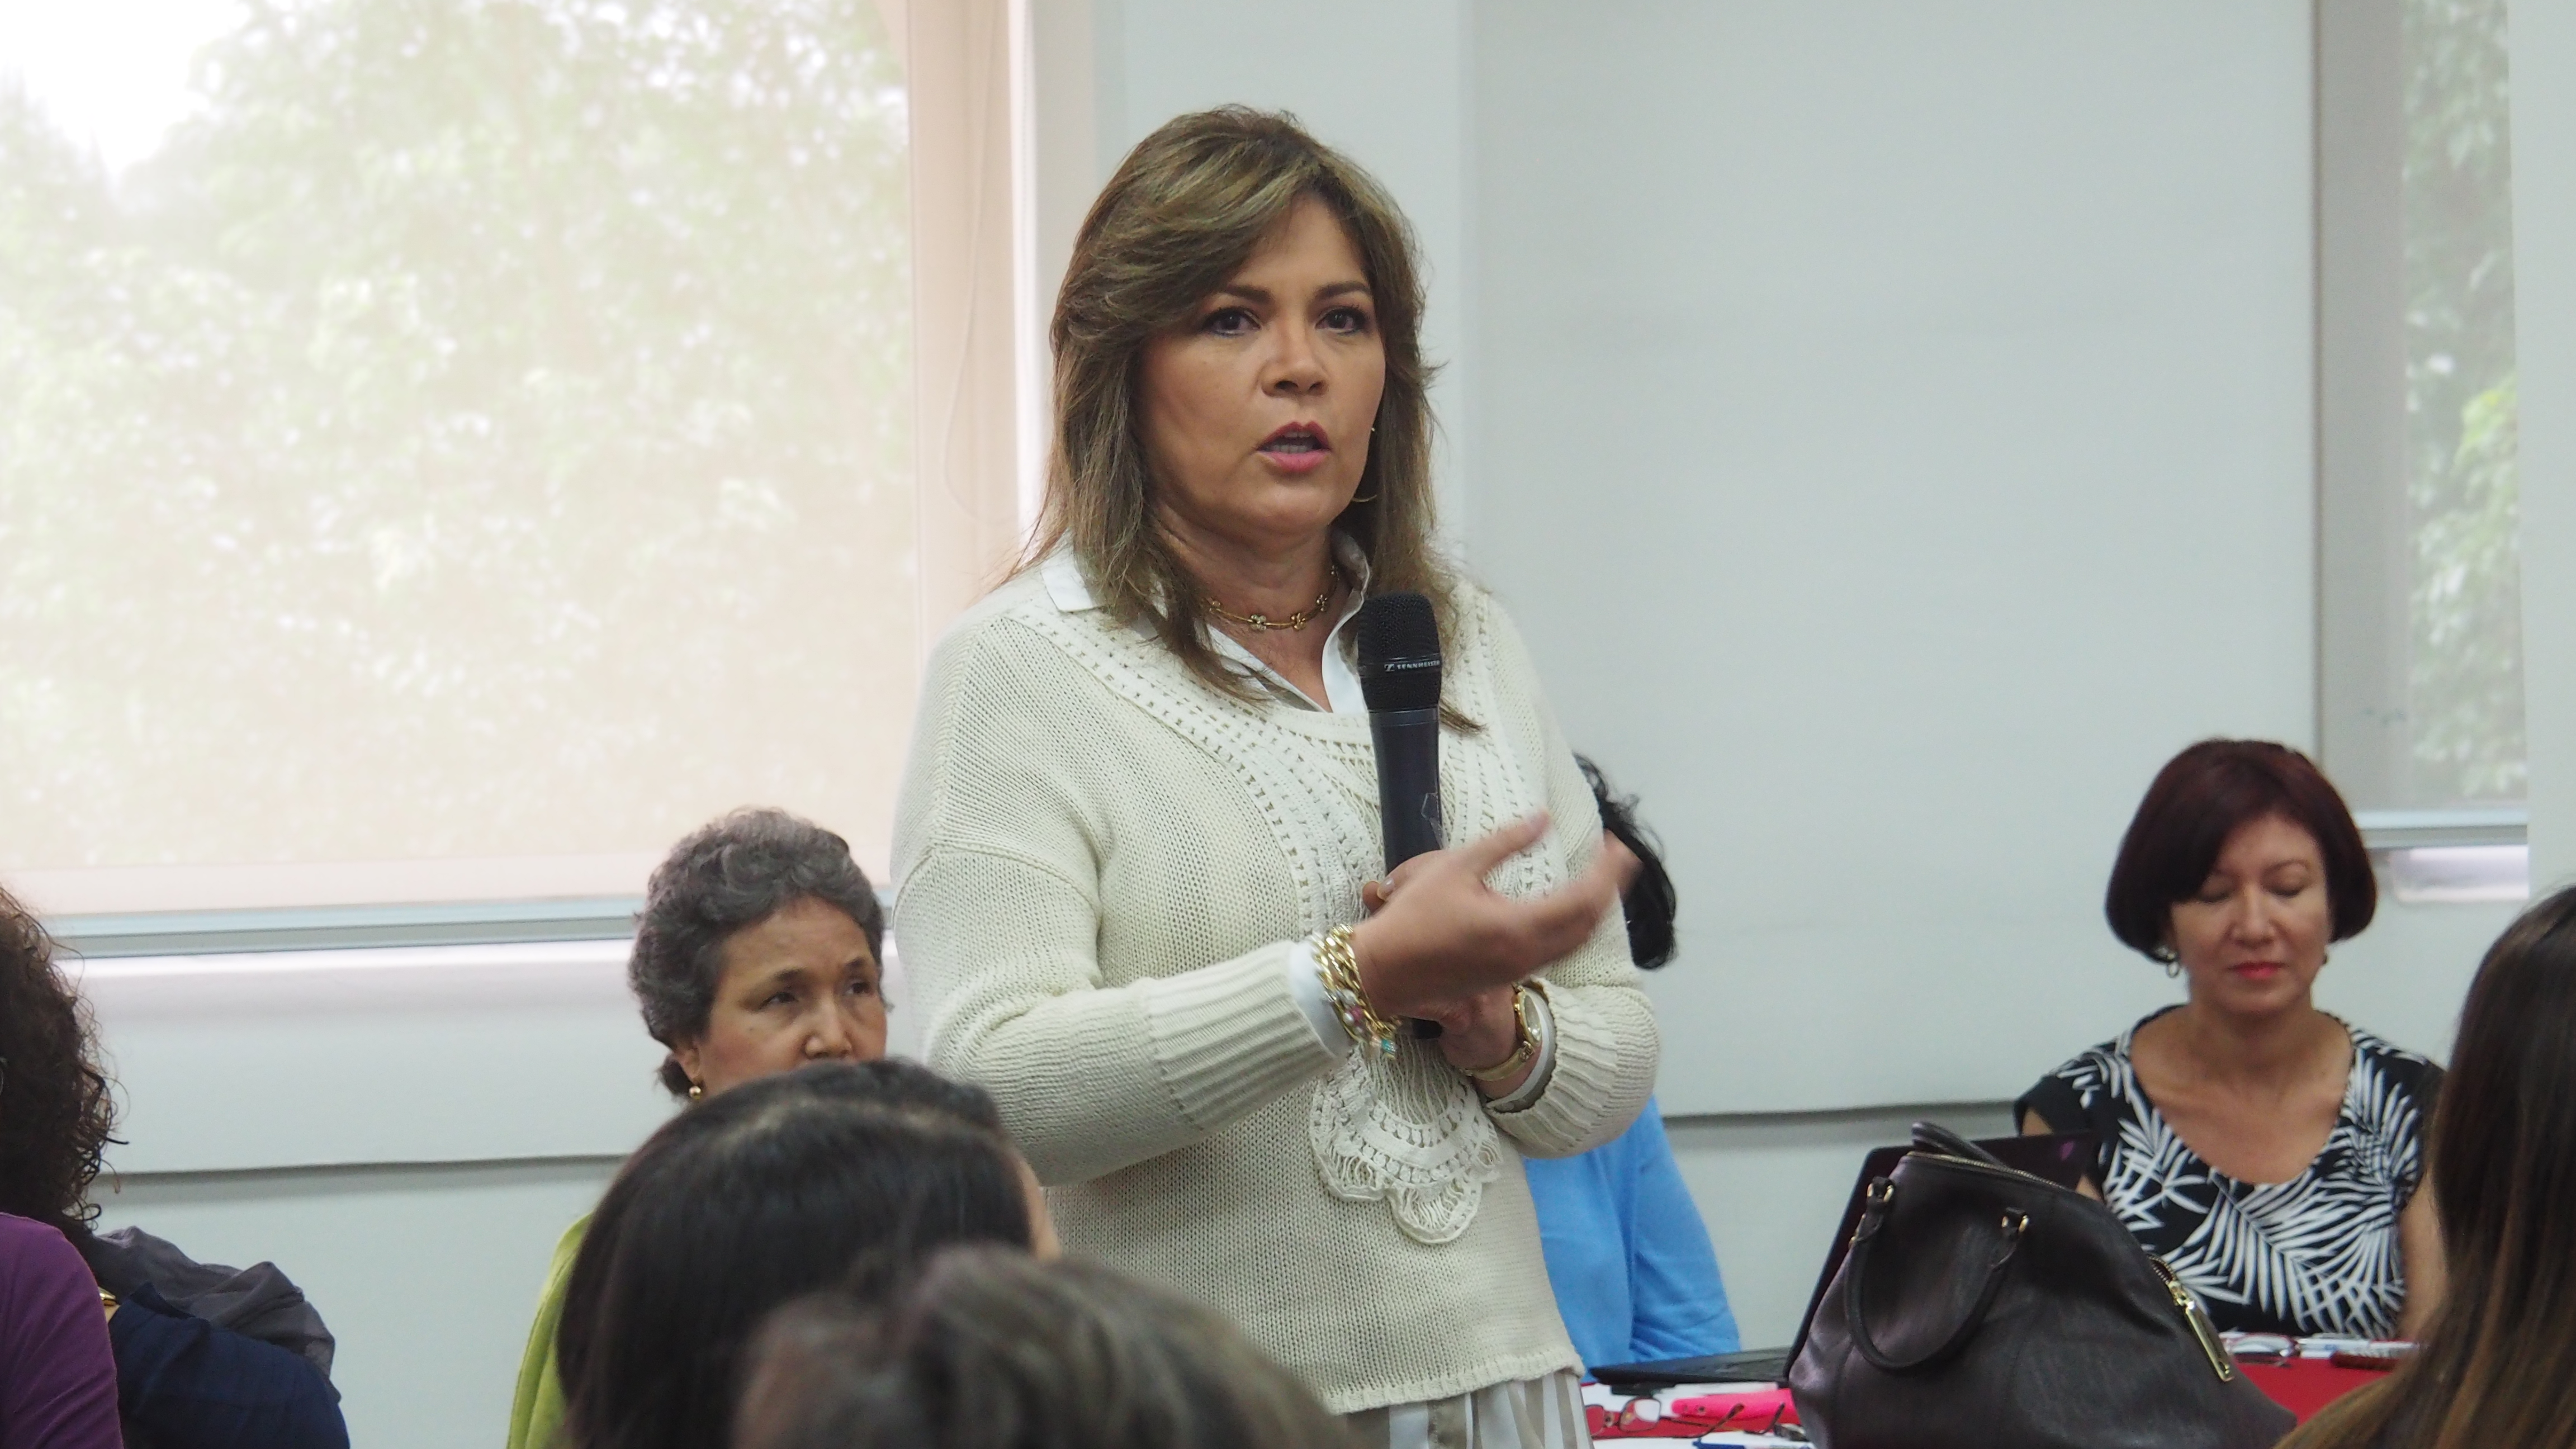
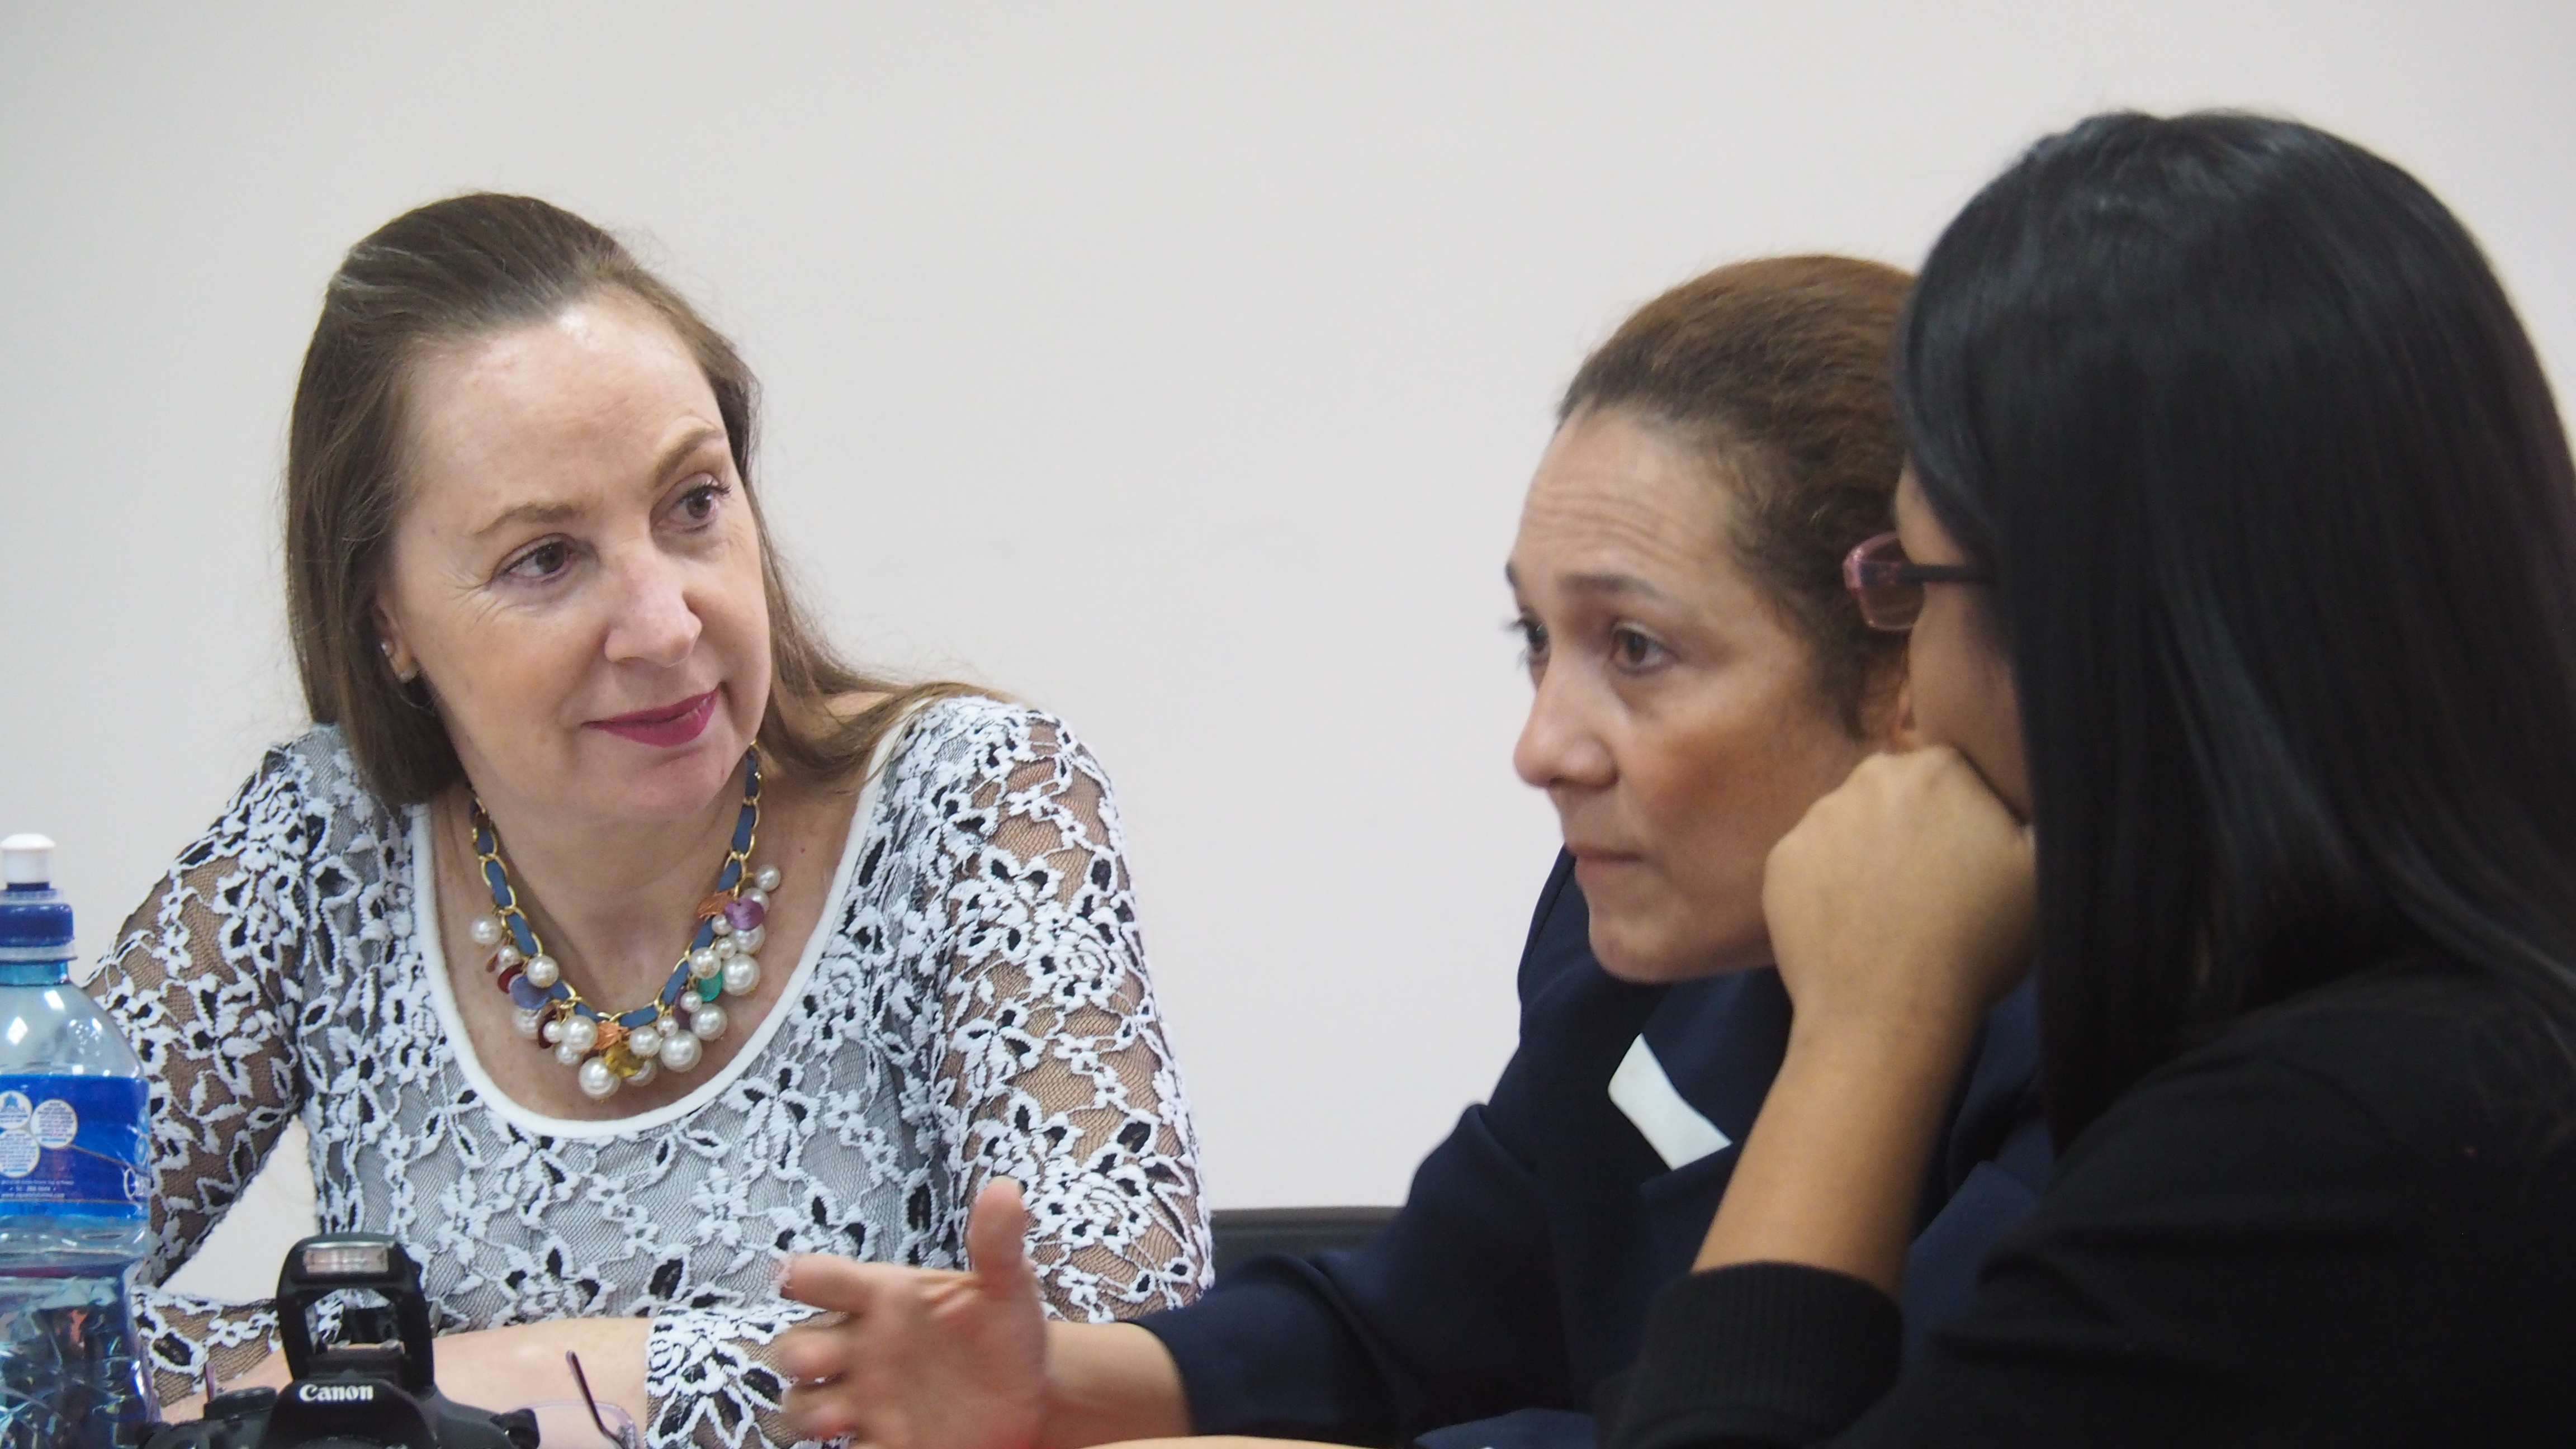
One of the participants shared her experience using Infogram and creating a data visualisation for a science story that she had worked on in the past. She explained how long it took her to process the data, how she had decided on a type of data visualisation, and how long it took her to put it together.
In the third session, participants got a list of free data sources and a detailed checklist for data processing. This session opened a useful dialogue between researchers, journalists, and communication staff about how they can collaborate and work with each other when it comes to finding, processing, and communicating data.
Storyboarding findings
 On the final day, the teams put everything covered in the workshop into practice, then worked on a storyboard addressing a local issue. The participants were encouraged to think big about how to tell their stories in a visual way. The evidence-based topics that the teams came up with ranged from how a coffee plant fungus is affecting the environment and the economy, the importance of coral reefs that are allegedly unaffected by climate change, malnutrition cases among children, the socioeconomic and environmental importance of protecting Panama’s wetlands, and immigration issues past and present.
Given carte blanche, the teams produced storyboards without worrying about technical limitations. One of the teams storyboarded an animated video showing where the coral reefs are on the ocean floor and what happens when fish feed on them. Another group used a set of infographics for sharing facts about immigrants – highlighting similarities rather than differences. The groups then pitched their story ideas for an article in SENACYT’s Imagina magazine. A link to the final article will follow shortly.
NOTA BENE
TWITTER FEED
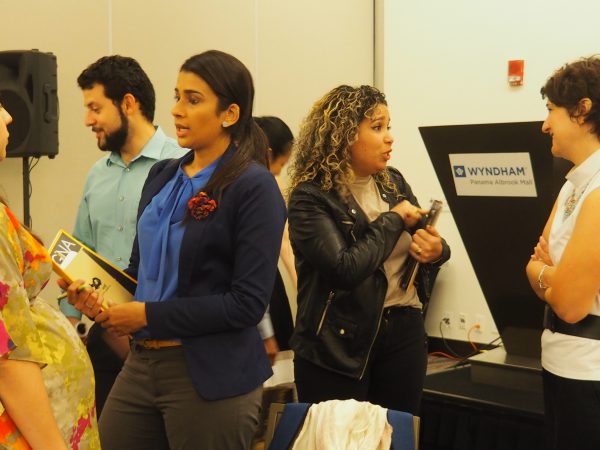
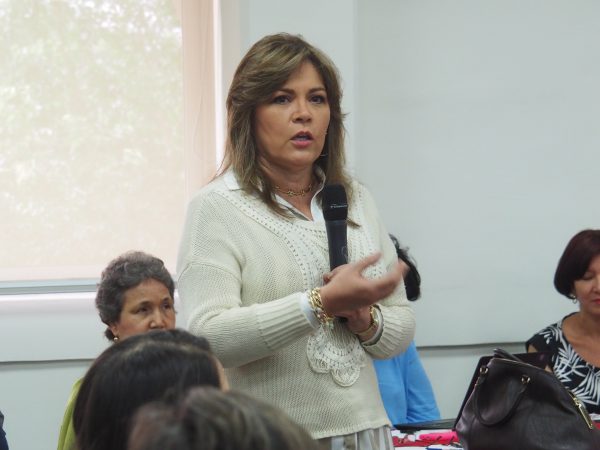
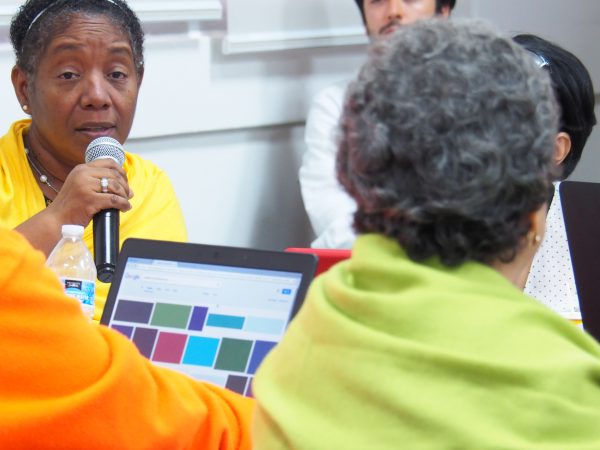
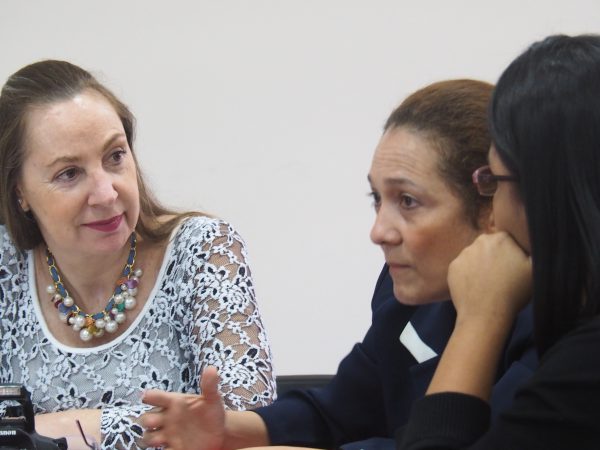
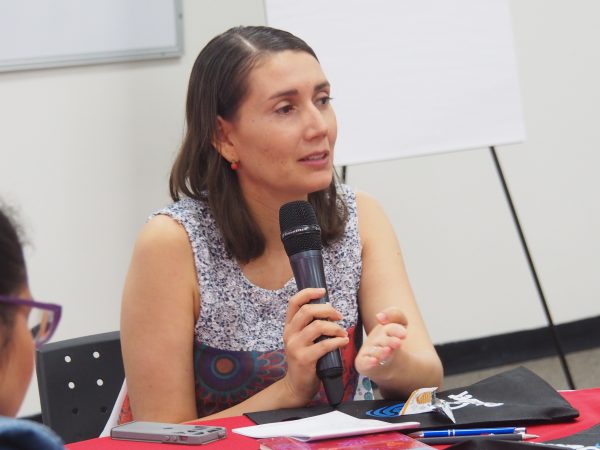
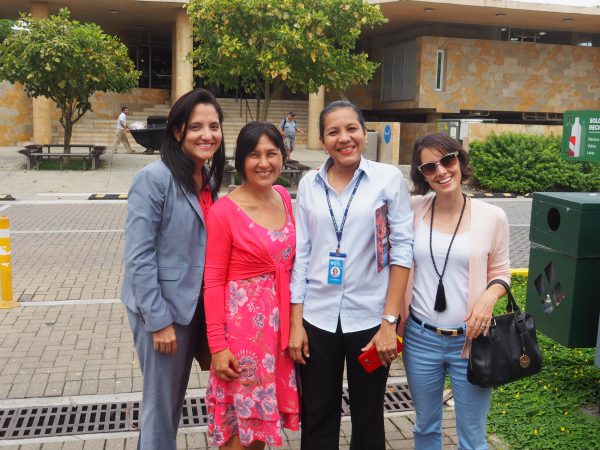
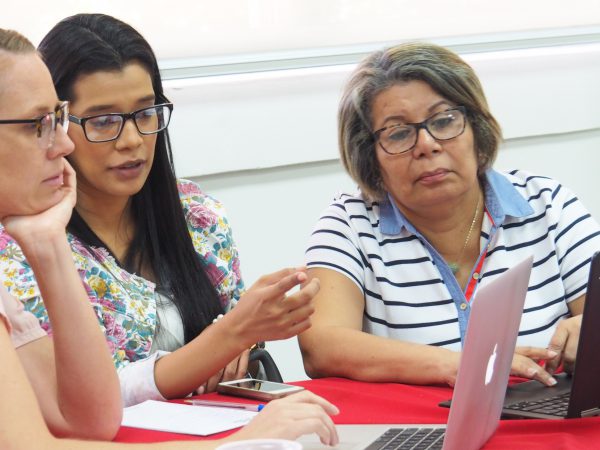
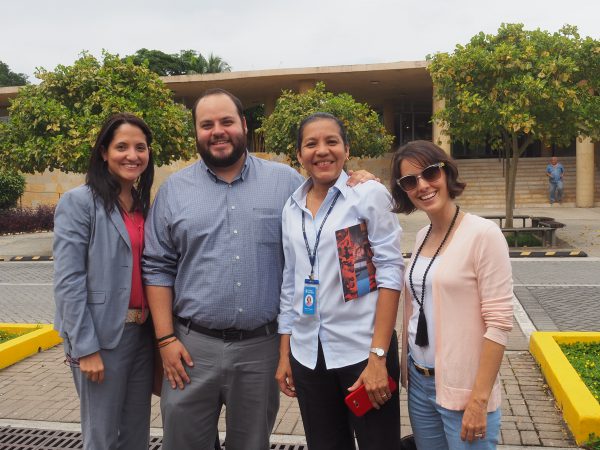
EVENT IMAGES
Media Credits: UNU S.Brodin