Co-authored by researchers Hugo Hollanders and Nordine Es-Sadki, the European Innovation Scoreboard gives a comparative analysis of innovation performance across EU member states, other European countries, and regional neighbours.
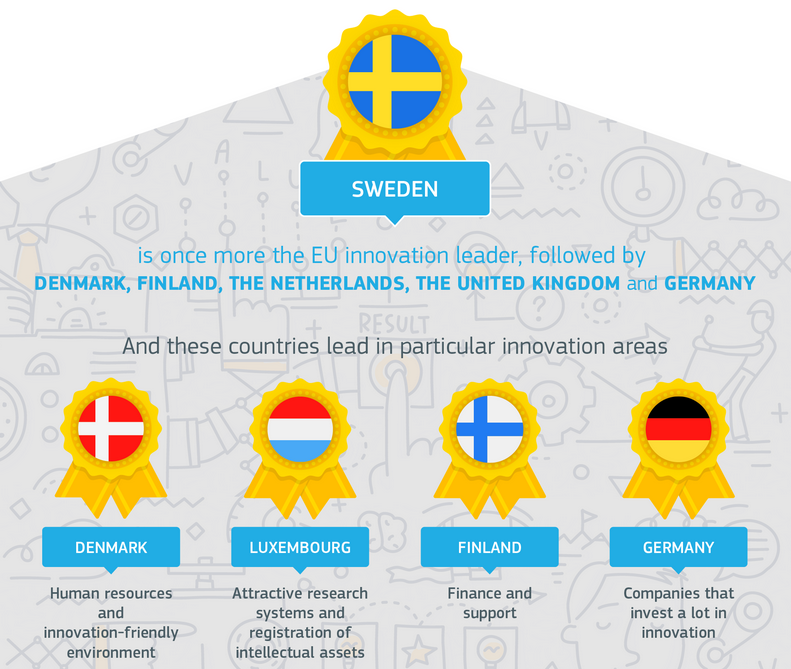
According to this year’s results, EU innovation performance continues to increase, partly thanks to improvements in human resources, the innovation-friendly environment, own-resource investments, and attractive research systems.
Overall, Sweden remains the EU innovation leader, followed by Denmark, Finland, the Netherlands, the UK, and Germany. Meanwhile, the fastest growing innovators include Lithuania, Malta, and Austria. In a global comparison, the EU is catching up with Canada and the USA, but South Korea and Japan are pulling ahead. China shows the fastest progress among international competitors.
Carlos Moedas, Commissioner for Research, Science and Innovation, said: “The Scoreboard shows that still more can be done to improve research and innovation performance. That’s why we’re gearing up support to breakthrough innovators through the pilot European Innovation Council under the EU’s Horizon 2020 research and innovation framework programme.”
 Elżbieta Bieńkowska, Commissioner for Internal Market, Industry, Entrepreneurship and SMEs, said: “EU industry continues to innovate, but we are still lagging behind global innovation leaders. In times of globalisation and rapid technology changes, innovation remains essential for the prosperity of our citizens and the wider European economy. The Commission’s Start-up and Scale-up Initiative and New Skills Agenda aim to further improve an ecosystem for innovation to thrive.”
New framework
The 2017 edition presents a refined analytical framework, meaning the rankings are not directly comparable with previous editions. Nevertheless, new indicators capture investments in skills, digital readiness, entrepreneurship, and public-private innovation partnerships. Additionally, a new toolbox with contextual data can be used to analyse and compare structural differences between countries.
See the executive summary below or download the full report here. More details on the methodology and database, as well as regional breakdowns, are available here.