We are now fast approaching the first anniversary of the UN Sustainable Development Goals (SDGs) – “a plan of action for people, planet and prosperity” – adopted 25 September 2015. In the run-up to the anniversary, this series will focus on various aspects of a new monitoring tool designed to measure impact and hold governments to account.
•••
The adoption of the Millennium Development Goals (MDGs) in September 2000 marked a key moment in global governance. On the education front, the MDGs were no paradigm-shifters — but from a policy perspective their sheer scope did help drive the global development agenda for education. Some 15 years after the Millennium Declaration, how much progress has there been across the development indicators for education? The results are inconclusive.
With the adoption of the Sustainable Development Goals (SDGs), we are now under a new regime and a new social reality. The implementation of the SDGs lies mainly with the UN Member States, but do these countries know what they have committed themselves to? What will it take to achieve these goals and targets? Are they affordable? What resources will be needed? Where will the money come from? In 2005, the High Level Group on Education for All (EFA) estimated that approximately 4-6% of GDP should be spent on education. Here, in addressing the benchmarks of SDG#4, one crucial aspect is fiscal resource capacity and allocation.
In an effort to shed more light on what exactly it will take to achieve the SDGs, I and four other PhD fellows authored a working paper: The Affordability of the Sustainable Development Goals: A myth or Reality? We selected five countries, two from the low income group (Ethiopia and Senegal) and the other three from the lower middle income category (Cambodia, El Salvador and Indonesia).
Measuring the shortfall
To quantify how SDG#4 and its targets can be achieved, we estimated the education gap. This displays the difference between a country’s education indicator (i.e., the current status) and what SDG#4 sets out to achieve. The specific benchmarks include access to education (target 4.1), quality of education (target 4.2), and state of equitable/inclusive education (target 4.5). The benchmarks make up the main governance targets (4.1, 4.2 and 4.5) for education, and are measured by primary and secondary completion rate (access), teacher pupil ratio (quality) and gender parity (inclusiveness) – all used as ‘proxy indicators’ with readily available data from the World Bank.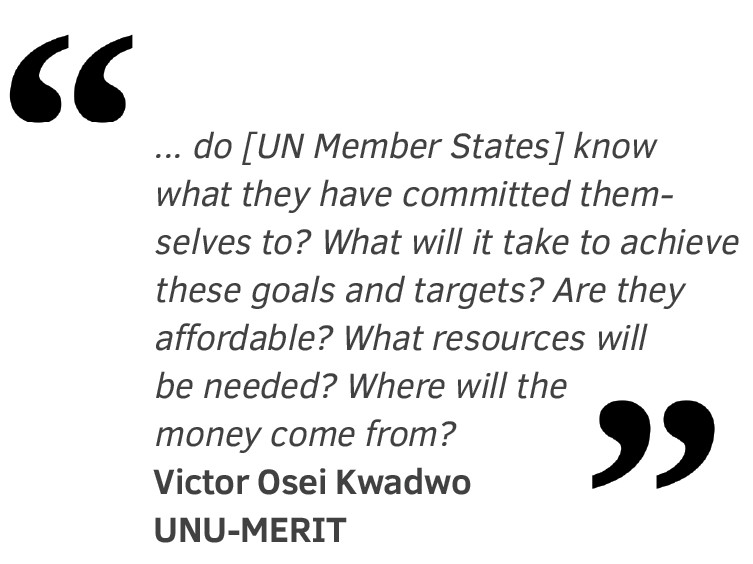
The selected indicators are measured in different ways. So, to have a comparable index to estimate an education gap, the indices of the respective indicators are standardised to a common measure ranging from 0 – 100. These are then aggregated as the overall education score for all countries with available data. For comparison, a benchmark (90.58 performance points) is set by assuming the average score of the top five performing countries (Georgia, Indonesia, Moldova, Sri Lanka, and Vietnam) within the low and lower-middle income countries categorisation.
To put a monetary value on these scores, we use the unweighted average expenditure on education as a percentage of GDP (4.18%) in the reference countries (Georgia, Indonesia, Moldova, Sri Lanka, and Vietnam). This equates to the investment required to achieve SDG#4 in each country. This is then multiplied by the percentage difference of a country’s education score and the average score of the top five performing countries to show how much Cambodia, El Salvador, Ethiopia, Indonesia and Senegal may have to invest to realise the education goal (see Table 1).
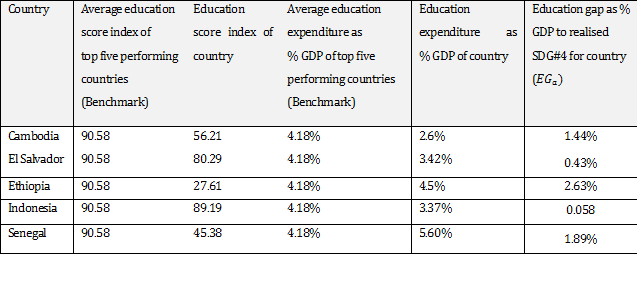
The assessment recognises the efficiency of budgetary allocation for education in each country. Though Senegal and Ethiopia allocate 5.60% and 4.5% of GDP to education, they are respectively the worst performers in education based on the aggregated score (45.38 and 27.61 out of 90.58 respectively). Given this result, Ethiopia and Senegal will need to invest an additional 2.63% and 1.89% of GDP respectively to education.
Here lessons can be learnt from Cambodia, which out of this group allocates the least of its GDP to education. Cambodia falls below the benchmark of 4.18%, yet achieves a fair performance in the aggregated education score (56.21 out of 90.58). The top performing country is El Salvador, with an aggregated education score of 80.29 out of 90.58. It therefore needs less additional commitments (0.43% of GDP) to achieve the education target by 2030. Likewise for Indonesia, which only requires 0.06% extra commitment (the least) on top of its current expenditure on education.
SDG#4 will indeed shape social realities, but fiscal capacity will be crucial to this story. It will underlie any mechanism for rolling out the social agenda of the SDGs – particularly if governments are to be held accountable.
ANY COMMENTS?
FULL SERIES
MEDIA CREDITS
UN Photo/Albert González Farran